
What's new in BreakTest
BreakTest forked Apache JMeter at 5.6.3, the last upstream release from January 2024. Since then, BreakTest has added reusable scenarios, environment profiles, native streaming protocols, faster scripting tools, and substantial engine improvements. Items marked with an arrow open with the full story: what changed, and why. Updated through BreakTest 2026.10.08. Per-release notes are on the download page.
AI
-
Create new test flows with AI
Describe a journey from an empty plan and build it with native test elements.
Use Specific request to create a flow from scratch or make a focused change. AI discovers installed native elements and can assemble samplers, controllers, timers, processors, WebSocket sessions, message handlers, paced loops, and background branches.
Created elements participate in backups, undo, and the AI change list. Generated flows request a bounded replay against a local synthetic fixture by default unless you opt out. That checks the generated flow; validation against your real backend is still needed. Supported settings depend on the installed elements.
-
AI Repair via built-in MCP server
Claude Code, Codex, or opencode can inspect, validate, fix, and rerun plans.
Task-directed prompts, compact edit confirmations, reused schemas, and batched operations reduce repeated context and token overhead. Model and reasoning controls let you tune each run; progress, usage summaries, and structured completion reports make its outcome easier to review. Savings depend on the task and model.
BreakTest includes an MCP (Model Context Protocol) server in the free tool. A connected agent, such as Claude Code, Codex, or opencode, can read the test plan structure, run validation, edit elements, and rerun checks in a closed loop. Because the agent sees actual responses, its fixes are based on what the server returned rather than inference from the script alone.
The tool set includes structural operations for cloning, moving, and deleting complete subtrees. They use the same code paths as GUI editing, so repairs preserve element properties instead of reconstructing them from partial data.
Repair runs are transactional: a failed batch is rolled back through undo, a pre-run backup can be restored explicitly, and an incomplete repair reports itself as blocked rather than as finished.
AI Repair is part of the free tool rather than the platform tier because script correlation and repair is where the most engineering time is lost, including on purely local tests.
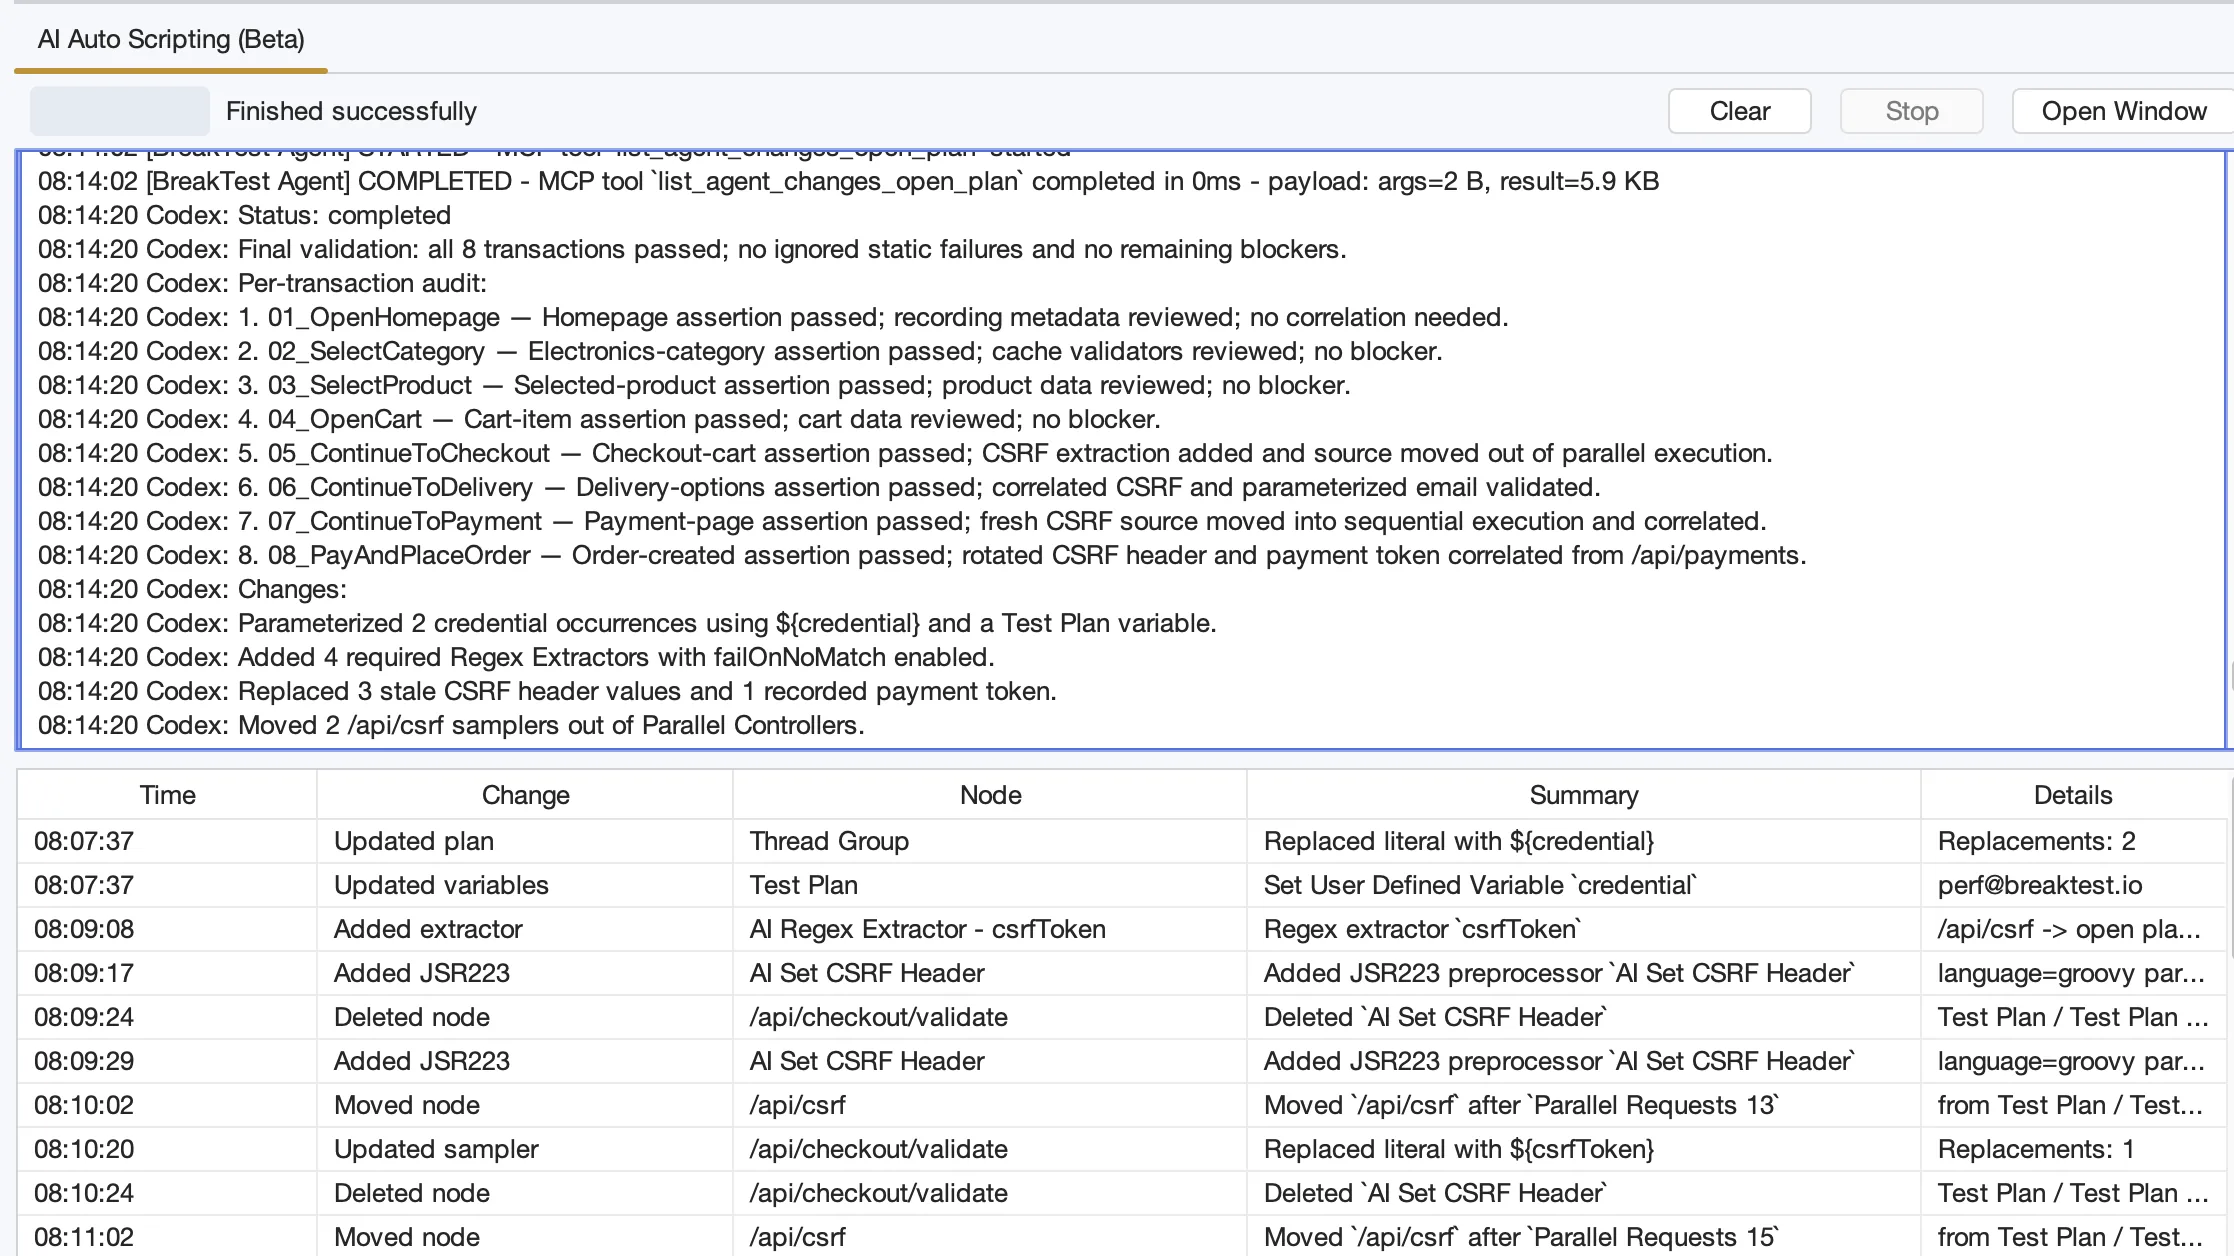
AI Repair validates the complete journey, reports what it fixed, and keeps an auditable history of every plan change. Select the image to open it full size. -
Choose your AI Repair harness
Use Claude Code, Codex, opencode, Pi Code, Gemini CLI, or Cursor Agent.
BreakTest supports AI Repair through Claude Code, Codex, opencode, Pi Code, Gemini CLI, and Cursor Agent. Each harness can inspect the plan, validate it against real responses, make changes, and rerun until the journey works or the repair reports a clear blocker.
Each harness has setup guidance for its own model, authentication, and execution settings. BreakTest detects which tools are installed, puts available harnesses first, and keeps the repair workflow inside the desktop application instead of requiring a manually assembled command line.
-
Full repair or targeted instructions
"Fix everything that fails" or "randomize this one field." Both work.
Two modes of operation. Full repair: the agent validates the plan, reads the failures, repairs correlation and selectors, and verifies by rerunning. Targeted instructions: state a specific change directly, such as randomizing a field, fixing the extractor on the login response, adding pacing to a transaction, or writing a Groovy helper for request signing.
Targeted mode exists because experienced engineers usually know precisely which change they want; the instruction replaces navigating the GUI to apply it manually.
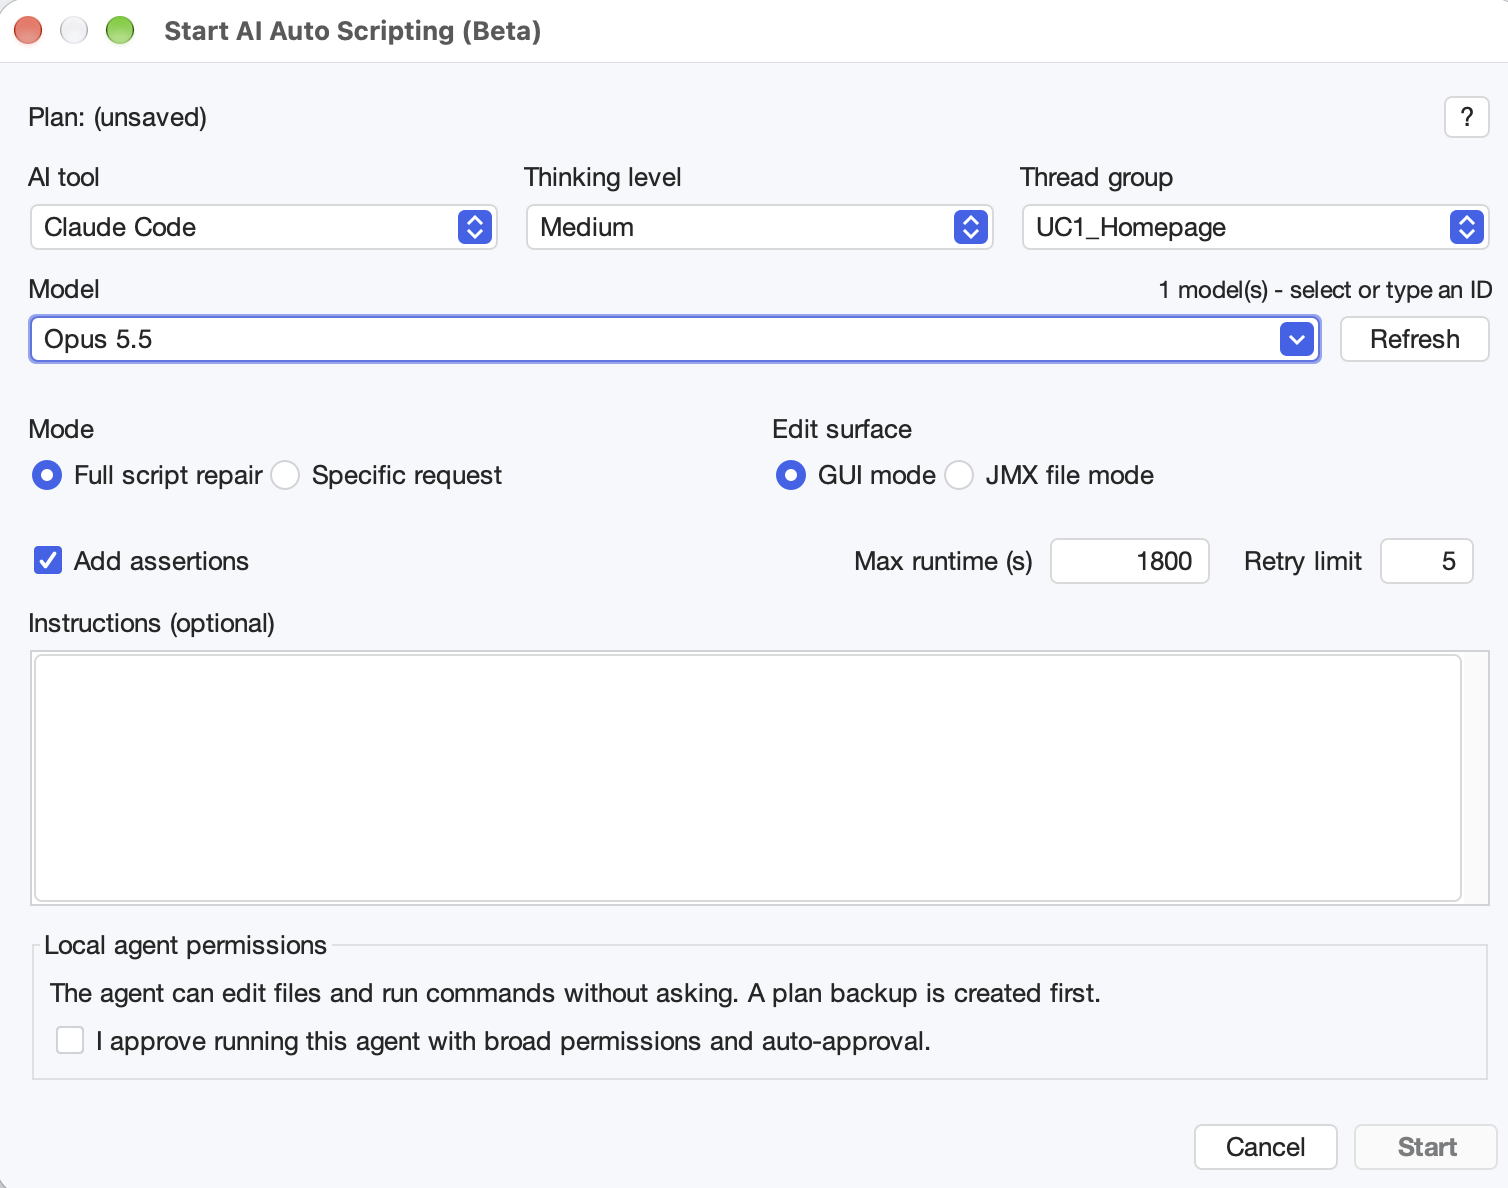
Configure a full script repair: choose the AI tool, model, thinking level, and thread group, with optional assertions and instructions. Select the image to open it full size. 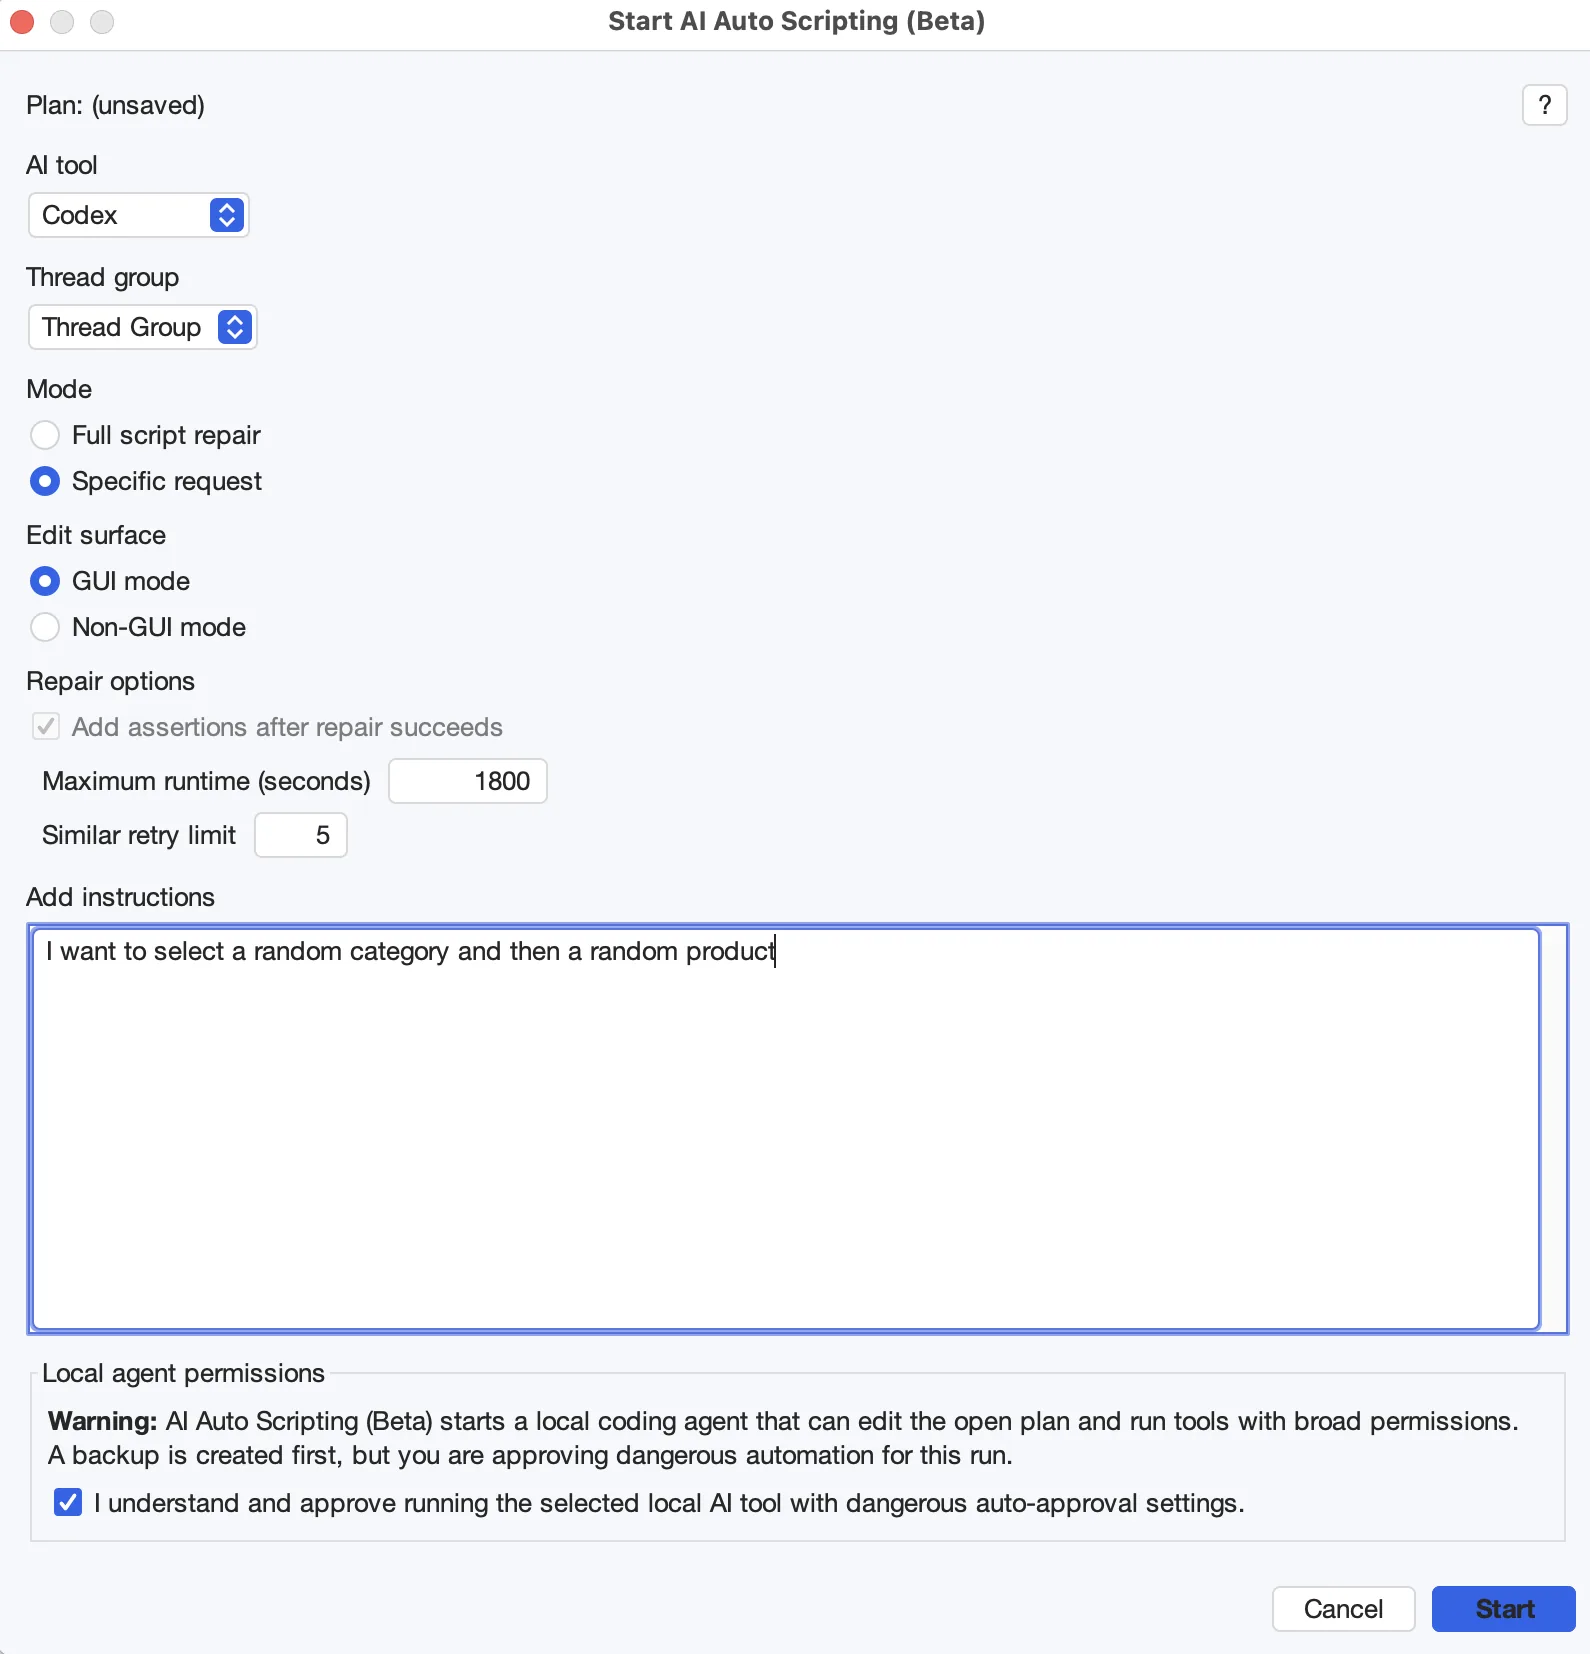
Choose full script repair or give Codex a specific change to make. Select the image to open it full size. -
AI chat inside Groovy scripts
Ask it to create, explain, improve, or fix code without leaving the editor.
A visible Ask AI button in JSR223 editors lets you select the AI CLI, provider/model, and reasoning level. Follow streamed output, stop a request, and review elapsed time and available token counts. Results return to the originating script even if you select another element while the request runs.
The Groovy script editor includes contextual AI chat. Describe what the script should do, or ask about the code already there, and the AI can create a complete script, finish an incomplete one, explain its behavior, improve its structure, or diagnose and fix a failure.
The chat works alongside the open script and its BreakTest context, so there is no need to copy code into a separate tool. Review the proposed change and apply it directly to the sampler, assertion, extractor, or helper you are editing.
-
Watch the AI work
Edits are highlighted live in the GUI as the agent makes them.
When AI Repair runs against a plan open in the GUI, each change is highlighted in the tree as the agent makes it, showing which elements were touched and in what order. The repair can be followed while it happens instead of being reconstructed from a file diff afterwards.
All AI edits pass through the normal undo history, so any change the agent makes can be reverted step by step, exactly like a manual edit.
HTTP & protocols
-
HTTP/2 on one modern client
HTTP/2 with automatic HTTP/1.1 fallback and true multiplexed concurrency.
BreakTest supports HTTP/2 through Apache HttpClient 5. Each connection negotiates the best protocol automatically: HTTP/2 when the endpoint supports it, with a seamless fallback to HTTP/1.1 when it does not. The same test plan works with both.
The Parallel Controller lets one virtual user issue 100 or more requests concurrently. With HTTP/2, those requests can be multiplexed as independent streams over the same connection, as HTTP/2 was designed to work, instead of opening a separate connection for every request.
This produces more realistic browser and service traffic. Your test exercises HTTP/2 concurrency, connection reuse, header compression, and the server's HTTP/2 code path under load, while remaining compatible with HTTP/1.1-only endpoints.
-
HTTP/3 over QUIC (beta)
Native HTTP/3 sampling on Java 27+, a first for the JMeter workflow.
Configured client certificates are supported on the normal HTTP/3 connection path. Self-signed or expired test certificates can use a certificate retry requiring a matching TCP TLS certificate at the original origin; the probe and retry count toward elapsed time. Automatic HTTP/3 discovery is opt-in.
BreakTest supports native HTTP/3 sampling over QUIC through the JDK HTTP client. Current releases require Java 27 or later for HTTP/3. Select HTTP/3 explicitly for an HTTP/3-only request, or allow TCP fallback when an endpoint does not accept QUIC. Compatible default-protocol samplers can also follow the browser pattern: start over HTTP/2 or HTTP/1.1, discover HTTP/3 through the server's
Alt-Svcresponse, and upgrade subsequent requests.The negotiated HTTP version, destination endpoint, and TLS version are stored with the sample result, so HTTP/3 traffic stays visible in the Results Tree and reports. Clients are reused per virtual user, requests can be interrupted cleanly, and QUIC timeouts use BreakTest's concise network error reporting.
HTTP/3 requires Java 27 or later. BreakTest itself and the standard HTTP samplers remain compatible with Java 21 and newer; on Java 21–26, an HTTP/3 sampler warns once and safely falls back to negotiated HTTP/2 or HTTP/1.1. This keeps the same JMX plan portable across load generators while making QUIC available wherever the runtime supports it.
HTTP/3 support is beta. Proxies, multipart uploads, Digest and NTLM authentication, and the HTTP Cache Manager are not yet available on the QUIC path. BreakTest rejects unsupported HTTP/3 combinations clearly instead of silently ignoring them.
Apache JMeter's built-in HTTP sampler does not support HTTP/3. BreakTest brings QUIC into the familiar JMeter test-plan, virtual-user, assertion, listener, and reporting workflow rather than limiting HTTP/3 testing to a command-line request benchmark.
-
Native WebSocket testing
Connect, send, wait, and react to messages in the same plan as HTTP requests.
Use named
ws://andwss://sessions per virtual user. Native Connect, Send, and Close elements handle text and binary messages. Send can return immediately or wait for a reply matched by a text regular expression or binary byte sequence.WebSocket Match handlers react to incoming messages, save message content into variables, and execute samplers and controllers in the originating user’s context. Handshakes share scoped HTTP cookies and headers and support subprotocols and client certificates.
Recorded conversations retain direction, timestamps, and payloads for inspection and correlation. Replay uses HTTP/1.1 Upgrade and does not negotiate compressed WebSocket messages, even though the recorder can capture them.
-
Native Server-Sent Events
Receive events in the background and trigger actions while the main script continues.
SSE Connect returns after the response headers arrive and receives events in the background over HTTP/1.1 or HTTP/2. It uses the familiar HTTP request editor, cookies, authentication, proxy settings, and TLS configuration.
SSE Match handlers select events by exact text or regular expression, optionally restricted to an event name, and execute actions in the virtual user’s context. Named streams can be reused, reconnected, or closed explicitly. Reconnection is script-controlled; SSE does not use HTTP/3.
-
Native UDP testing
UDP Request and UDP Receiver samplers with text, hex, and raw payloads.
BreakTest includes native UDP Request and UDP Receiver samplers. UDP Request supports request/response and fire-and-forget datagrams, local address and port binding, configurable timeouts, named per-user socket reuse, and optional handling of unreachable destinations. UDP Receiver reads subsequent datagrams from a named socket and can treat receive timeouts either as successful no-content samples or as failures.
Payloads are entered as UTF-8 text, hexadecimal, or single-byte text via a format selector; custom encodings can be implemented against the native
UDPTrafficCodecextension point. Oversized datagrams are validated before sending, truncation is detected on receive, buffers are reused, and named sockets are isolated per virtual user, including under parallel ForEach and Fork execution.JMeter has no built-in UDP support; testing UDP protocols required third-party plugins with their own dependencies and limited integration with the execution model.
-
Client certificates per environment or virtual user
Scope TLS identities to profiles, thread groups, controllers, or individual requests.
Client Certificate Config lets you inherit an identity, select a certificate, or explicitly send none. Configure shared or named profiles and override them closer to a request for HTTPS and secure WebSocket handshakes.
Keystore paths, passwords, and aliases accept variables, allowing different identities per virtual user. PKCS12, JKS, and JCEKS stores must include a private key and certificate chain. Invalid settings fail the request, and authenticated connections are isolated by certificate identity. Existing WebSocket sessions retain their identity until reconnected.
-
Brotli & Zstandard decompression
Response decompression covers br and zstd alongside gzip and deflate.
BreakTest decodes Brotli and Zstandard response encodings natively, in addition to gzip and deflate. JMeter 5.6.3 does not decode either format, although CDNs and modern services increasingly use them.
With native decoding, assertions and extractors operate on the actual response body rather than compressed bytes, and recorded response sizes remain accurate.
-
Readable timeout errors
Expected connect/response timeouts report as one line, not a stack trace.
BreakTest reports connect and response timeouts as a single line stating what timed out, against which endpoint, and at what configured limit. JMeter logged every timeout with a full Java stack trace. That added no useful information because the timeout limit and endpoint are the relevant facts, and it made logs and the results tree difficult to read during a run with many failures.
Unexpected errors still include full detail. The distinction keeps expected load-test outcomes (a slow system under test) visually separate from actual tool or script failures.
Performance
-
Faster startup, JMX loading, and a more responsive UI
Start working sooner, open large projects faster, and edit without long freezes.
BreakTest starts much faster, loads JMX projects much faster, and makes everyday work in the UI more responsive. Fast loading is now the default, avoiding initialization of every element editor when a plan opens. Command-line runs also skip unnecessary GUI processing and unused recording attachments.
Large request bodies and long lines remain editable through a plain-text layout, while correlation scans reuse parsed JSON responses and offer progress and cancellation. These changes reduce time spent waiting when opening, inspecting, and editing large test plans.
-
50–80% less memory, up to 50% less CPU
The same plans, a fraction of the footprint of JMeter 5.6.3.
Measured scenarios show roughly 50–80% lower memory use and up to 50% lower CPU use than JMeter 5.6.3 on the same test plans, depending on the plan and workload. The reduction is the combined effect of several engine changes: lazy response decompression, response retention modes, lightweight test-plan cloning, per-thread buffer reuse, header-merge reuse, bounded HTTP/2 reactors, and lazy diagnostics collection.
The practical result is more virtual users per load generator before garbage-collection pauses begin to distort latency measurements, and fewer machines for the same load. Generator resource usage affects measurement validity as well as cost: a generator running near CPU saturation adds its own latency to every sample it records.
-
Lazy decompression & response retention modes
Bodies stay compressed until read; keep everything, failures only, or checksums.
BreakTest stores response bodies in their compressed form and decompresses only when an assertion, extractor, or viewer actually reads them. JMeter decompressed and buffered every response unconditionally, spending CPU and heap on data that was often never inspected.
Retention modes additionally control what is kept per response: the full body, the compressed body, failures only, or an MD5 checksum in place of the body. Full retention suits scripting and debugging; failures-only suits load runs; checksums suit soak tests where the only question is whether content changed.
-
Less churn per virtual user
Lightweight test-plan clones save significant memory per virtual user.
JMeter creates a full deep clone of the test plan for every virtual user. At high thread counts, those complete copies consume substantial heap before the test has sent a request.
BreakTest uses a lightweight clone that shares immutable plan data while keeping each virtual user's runtime state isolated. The test behaves the same, but requires significantly less memory per user and creates far less allocation pressure during startup.
-
Java 21+ & virtual threads
Java 21 baseline, with Java 27+ support for HTTP/3 over QUIC.
BreakTest requires Java 21 or later. The raised baseline removed a large amount of version-compatibility code and directly enables current JVM features, most visibly virtual threads for virtual-user execution and embedded resource downloads. On virtual threads, a blocked thread costs almost nothing, which fits a load generator's workload profile of many concurrent blocking I/O operations.
Virtual threads are applied selectively rather than globally: code paths that pin carrier threads can perform worse on virtual threads, so they are used where blocking-I/O concurrency dominates.
Java 21 remains the minimum and Java 25 is recommended for general use. Run BreakTest on Java 27 or later when you want native HTTP/3 over QUIC; the standard HTTP/2 and HTTP/1.1 paths continue to work on Java 21 and newer.
Load model & controllers
-
Multi scenario / workload support
Define load, stress, smoke, and endurance tests with their own thread groups, workloads, and profiles.
Define multiple performance tests in one plan, such as a smoke test, load test, stress test, or endurance test. Each scenario combines the thread groups in scope and gives each one its own workload settings and profile. The same thread-group script can be reused across scenarios or added more than once without duplicating the journey.
Configure the workload model, thread count, schedule, duration, loops, pacing, and error handling per scenario row. Run the selected thread groups together or one after another, and switch scenarios to run a different test against the same scripts.
The scenario editor summarizes peak load and duration and flags unresolved values before execution. Choose the active scenario, use Run this scenario, or select it in a non-GUI run with
--scenario.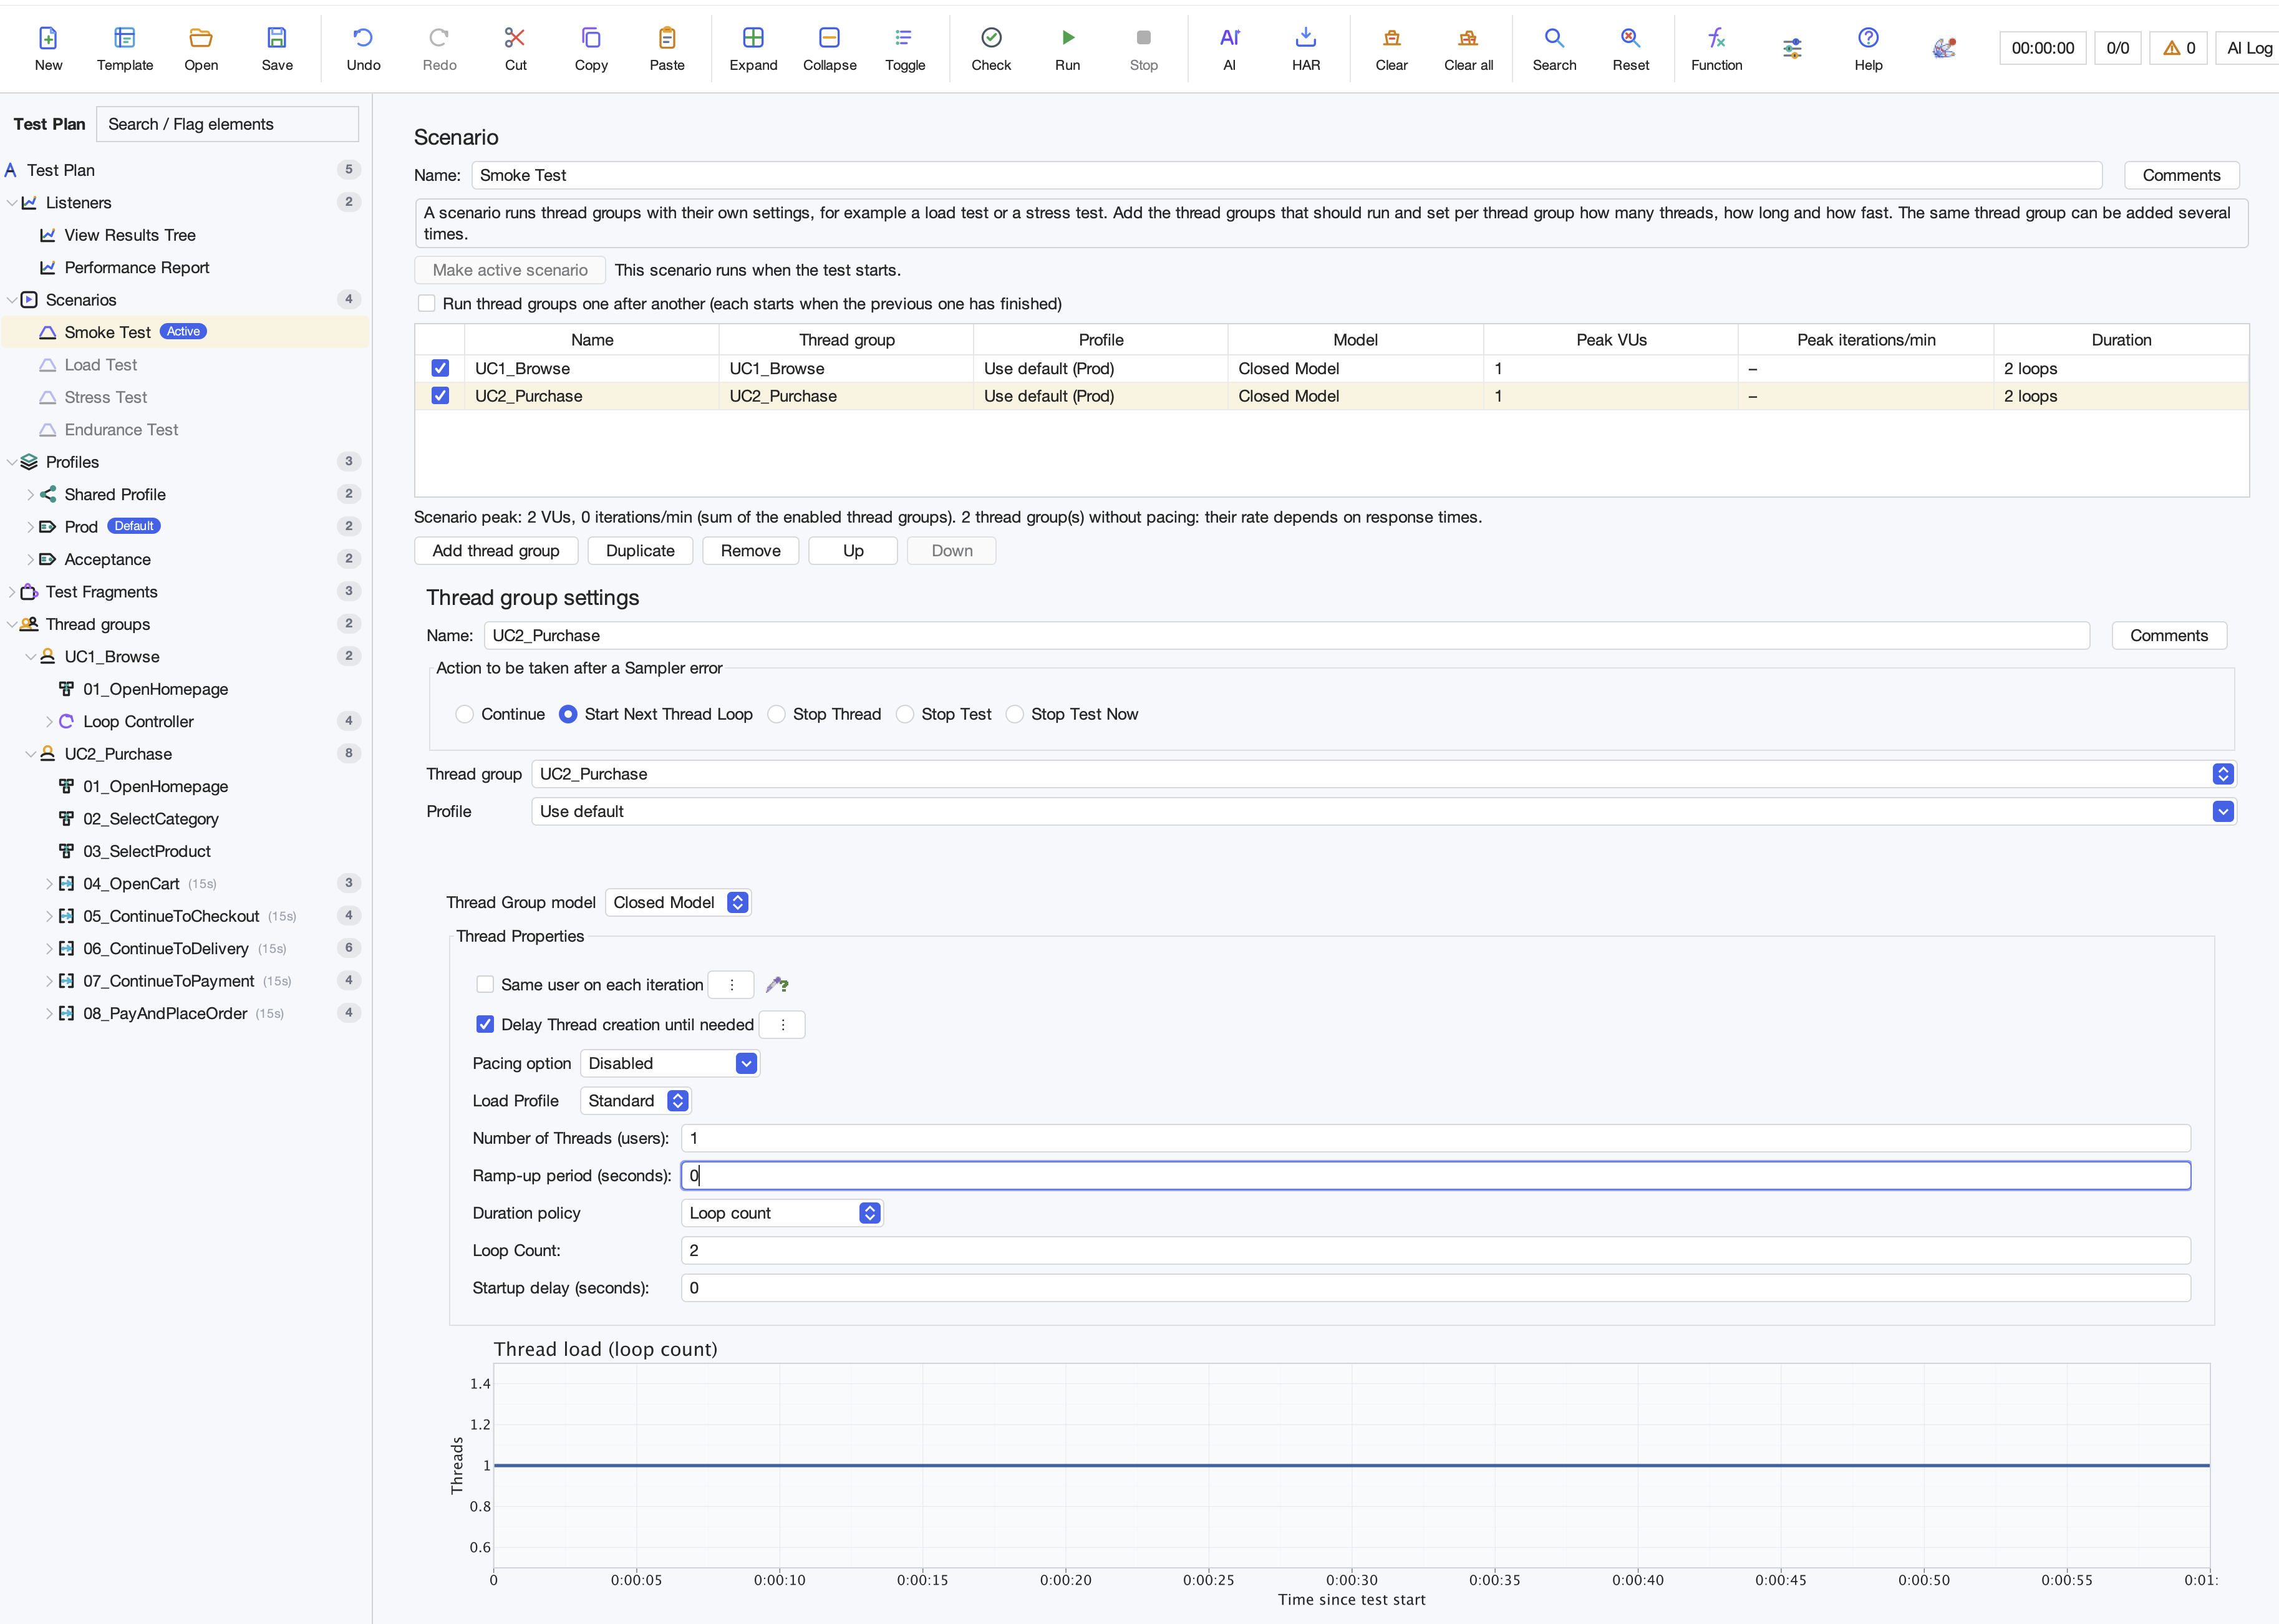
Combine thread groups in a scenario and give each its own workload settings and profile. Select the image to open it full size. -
Profiles support
Switch between environments or test-data sets using separate parameters and CSV files.
Profiles keep separate CSV files, parameters, and configuration for different environments or specific test cases. Define environment values and data sources once, for example application URLs and user data for Acceptance and Production, instead of changing them throughout the test plan.
Use profiles in scenarios to run the same thread-group scripts against another environment or a different set of test data. Choose a default profile or select a profile for an individual workload row. Shared Profile holds configuration common to the profiles.
This makes switching test environments or data sets a profile choice rather than a round of script edits. In non-GUI runs,
--profilechanges rows using the default profile; explicit row selections remain in effect. -
Weighted traffic flows
Choose a journey using relative weights, without a controller plugin.
The native Weighted Switch Controller chooses one direct child each time it is entered. Configure relative, non-negative weights to model a mix of journeys; disabled and zero-weight children are excluded.
Weights stay attached to their children when you rename, reorder, copy, or save them. Selection is probabilistic, so the weights describe a traffic distribution rather than exact quotas.
-
Wait for background work without polling
Coordinate the main flow with asynchronous forks using conditions and a timeout.
Wait for value supports Match all and Match any conditions and wakes when parameters change within the same virtual user. Start a producer in an asynchronous fork, then wait for it to supply a value without repeatedly running a polling script.
Successful waits are ignored in results by default; timeouts remain visible. This observes parameter writes, including shared fork and parallel views, rather than global properties, external state, or objects changed in place.
-
Closed & open workload schedules
Edit ramp/hold phases or arrival rates in schedule tables, with random arrivals.
Scenarios configure reusable thread-group scripts as closed or open workloads. Closed mode sets concurrent users through ramp and hold phases; open mode schedules arrivals independently of response times, with a cap on active users.
Add, delete, and reorder load phases in compact schedule tables. Open workloads support random arrivals, while text view retains comments and advanced expressions. Scenario summaries show workload peaks and duration and flag unresolved values.
A closed workload slows its incoming traffic when users wait longer for responses. An open workload preserves scheduled arrivals. Choose the model that matches the behavior you want to measure.
-
Parallel Controller
Browser-like concurrent requests inside one virtual user.
The Parallel Controller executes its child elements concurrently within a single virtual user, with bounded scheduling and safeguards around shared HTTP state such as cookies and the cache, which were not designed for intra-user concurrency.
Browsers load page resources such as scripts, styles, and API calls over several connections at once. JMeter executes strictly sequentially within a virtual user, so this behavior had to be approximated with additional thread groups and synchronization timers, which is fragile and produces incorrect timing. With native parallel execution, transaction timings for composite pages correspond to what a browser-driven user actually experiences.
-
Fork Controller
Fire-and-continue branches that share the virtual user's context.
Choose whether a fork stops immediately, finishes current samplers, completes fully, or keeps running at the main iteration boundary. On re-entry, skip an active fork, restart it, or wait. Fork errors can continue, stop the background branch, or end the main iteration independently of the thread group’s policy.
Plans without explicit lifecycle settings now default to graceful iteration-end shutdown and skipping an already-running fork. Review older keep-alive and looping flows when upgrading.
The Fork Controller starts its child elements asynchronously and lets the main scripted flow continue immediately. The forked branch shares the virtual user's variables and session context, modeling background traffic from the same user, such as analytics beacons, background polling, and long-running exports.
JMeter has no equivalent: background traffic either had to be modeled inline, distorting transaction timings, or omitted, understating the load.
Scripts can control active branches explicitly:
ctx.getThread().stopForks()requests graceful completion, andstopForksNow()cancels them. -
Parallel ForEach execution
ForEach branches can run concurrently with a bounded worker pool.
The ForEach Controller can execute its branches in parallel with a configurable maximum concurrency. Branches are created lazily as worker slots become available, so iterating over very large value lists does not create all controller clones up front. Retained state is proportional to the configured parallelism, not the item count. This is verified in benchmarks with inputs of a million values.
JMeter's ForEach is strictly sequential, so iterating an extracted list of 50 links takes 50 consecutive request times. A real client fans such requests out concurrently.
Parallel execution is opt-in per controller; existing plans keep their sequential behavior unless it is enabled.
-
Pause & resume a running test
Pause the workload schedule without stopping virtual users already running.
Pause and resume control the workload schedule, not the virtual users already running. Existing users keep executing their plans normally. In a closed workload model, ramp-up stops and no new threads are started; in an open model, scheduled arrivals stop. Resuming continues the schedule and allows new users to start again.
This lets you stop adding load while observing how the system and existing users behave. Pause and resume are available in the GUI and on the command port, and the distribution includes
bin/pauseandbin/resumewrappers for scripted use. -
Thread Group pacing & clean iterations
Pace iterations directly; new iterations start with clean variables.
Scenario workload rows configure iteration pacing for their thread-group scripts: a fixed rhythm per iteration independent of response times, used to hold a target transaction rate in a closed workload model. In JMeter this required constructing the same behavior from timers and arithmetic that stopped being correct as soon as response times drifted.
Iteration isolation is also corrected: when same-user mode is disabled, each iteration represents a new user, and BreakTest clears runtime variables at iteration start while preserving initial definitions. Previously, state could carry over from one simulated user to the next and mask correlation errors.
-
Explicit transaction timing & think times
Choose summed sampler time or real elapsed time, with or without embedded timers.
Transaction Controllers let you choose exactly how the reported response time is measured. Sum of sampler times adds the duration of every child sampler. Total run time including timers measures the real wall-clock time from the start of the transaction until it completes. Total run time excluding embedded timers measures that same elapsed execution time but removes delay introduced by timers inside the transaction.
This distinction matters with parallel execution: child samplers overlap, so adding all their durations produces a value longer than the transaction actually took. The two total-run-time modes report the real elapsed duration, while the summed mode remains available for compatibility with traditional JMeter measurements. Existing JMX files retain their original behavior.
Think time is configured on the transaction itself: fixed, random, or Gaussian delay and pacing per transaction. This replaces the JMeter pattern of placing timer elements in the tree and relying on scoping rules to determine where they apply.
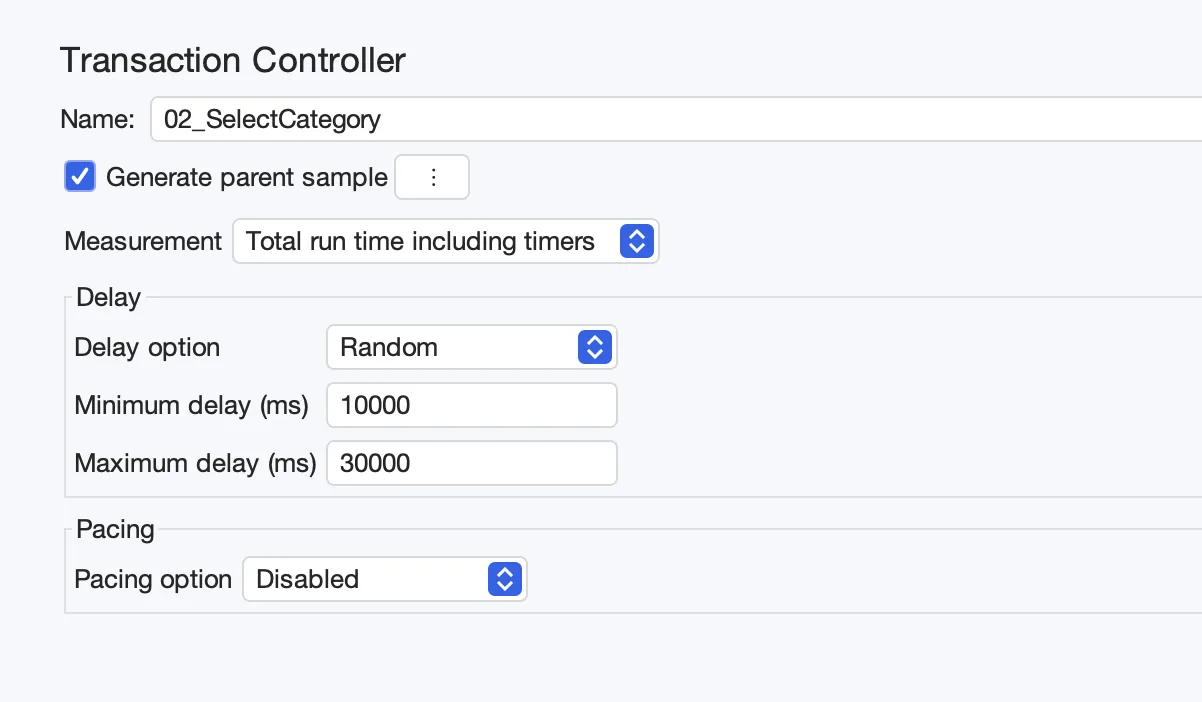
Transaction response-time measurement, think-time delay, and pacing in one controller. Select the image to open it full size. -
Stops that actually stop
Shutdown releases timer waits and only lets in-flight responses finish.
On shutdown, BreakTest releases all waiting states, including ramp-up delays, timers, transaction pacing, and sampler waits, and only allows in-flight requests to complete. The results file ends with valid, completed samples.
In JMeter, a stop request did not interrupt sleeping threads, so a test with long think times could take minutes to shut down while thousands of threads finished their timer waits.
Scripting & data
-
Native scripting utilities
Hashing, encoding, strings, environment values, and timestamps without a function plugin.
Built-in functions cover hashing, Base64 and hexadecimal encoding, string manipulation, conditional values, environment variables, iteration numbers, and epoch timestamps. Common request preparation no longer requires an extra function plugin.
Invalid arguments produce warnings and clear the configured result variable instead of leaving an earlier value behind.
-
Dummy Sampler
Generate sample results without network traffic or a third-party plugin.
Create HTTP, standard, or statistical results with configurable request and response content, status, timings, byte sizes, and binary payloads. This is useful for developing and checking test-plan logic without making a real network request.
Optional response-time simulation uses interruptible waits. Invalid settings produce a failed result with diagnostics.
-
Variable and function autocomplete
Type
${to discover variables in scope and insert functions without memorizing their names.BreakTest suggests variables as you type
${in component fields, table cells, multiline editors, and expanded dialogs. Suggestions come from enabled definitions in the test plan and current thread group, including configured CSV variable names, extractors, counters, and User Parameters. Type${_to browse installed functions.Use the arrow keys to choose a suggestion, Enter or Tab to insert it, and Escape to dismiss the list. Completion preserves the surrounding text and recognizes extractor match counts, indexed matches, and capture groups. It also works in the Search Tree dialog's Search and Replace by fields.
This makes parameterizing requests and reusing extracted values quicker, with fewer misspelled variable references and less switching between elements to look up names. Suggestions use definitions in the plan rather than values from a running test; JSR223 script bodies are excluded.
-
Portable test data inside your JMX
Bundle CSVs and upload files with the plan; manage them through the Archive browser.
CSV Data Sets and HTTP file uploads can use files stored inside the JMX archive. Tools → Archive browser lets you add, browse, export, and delete these shared files, so the plan and the data it needs can travel together in one file.
This makes handing a test to a colleague or moving it to another machine simpler: bundled data stays with the plan instead of depending on separate files at local paths. Other file fields that support functions can access archived files through
${__archiveFile(filename)}. -
Edit CSV data inside BreakTest
Edit external or archived CSVs, copy them into the plan, and export them back to disk.
The Edit CSV dialog opens both external CSV files and CSVs stored in the JMX archive, with Save and Cancel controls. You can adjust test data directly inside BreakTest without switching to a separate editor.
Copy an external CSV into the archive to keep it with the test plan, or export an archived CSV back to disk for use elsewhere. This brings data editing and portability into the same workflow as configuring the CSV Data Set.
-
Find and correlate dynamic values visually
Find a request value in earlier responses, preview regex matches, and review replacements before applying.
Use an HTTP parameter value's context menu to search for that value in earlier recorded responses. Results show sampler paths and surrounding content; opening a result selects the matching value in the recorded response, making it easier to find where a token or identifier originated.
Live regular-expression previews use recorded sample data to show extracted variables, capture groups, occurrence counts, and parse time. Replacement actions show the affected sampler paths before applying changes and protect existing variable references, helping you turn recorded values into reusable correlations with a clear view of what will change.
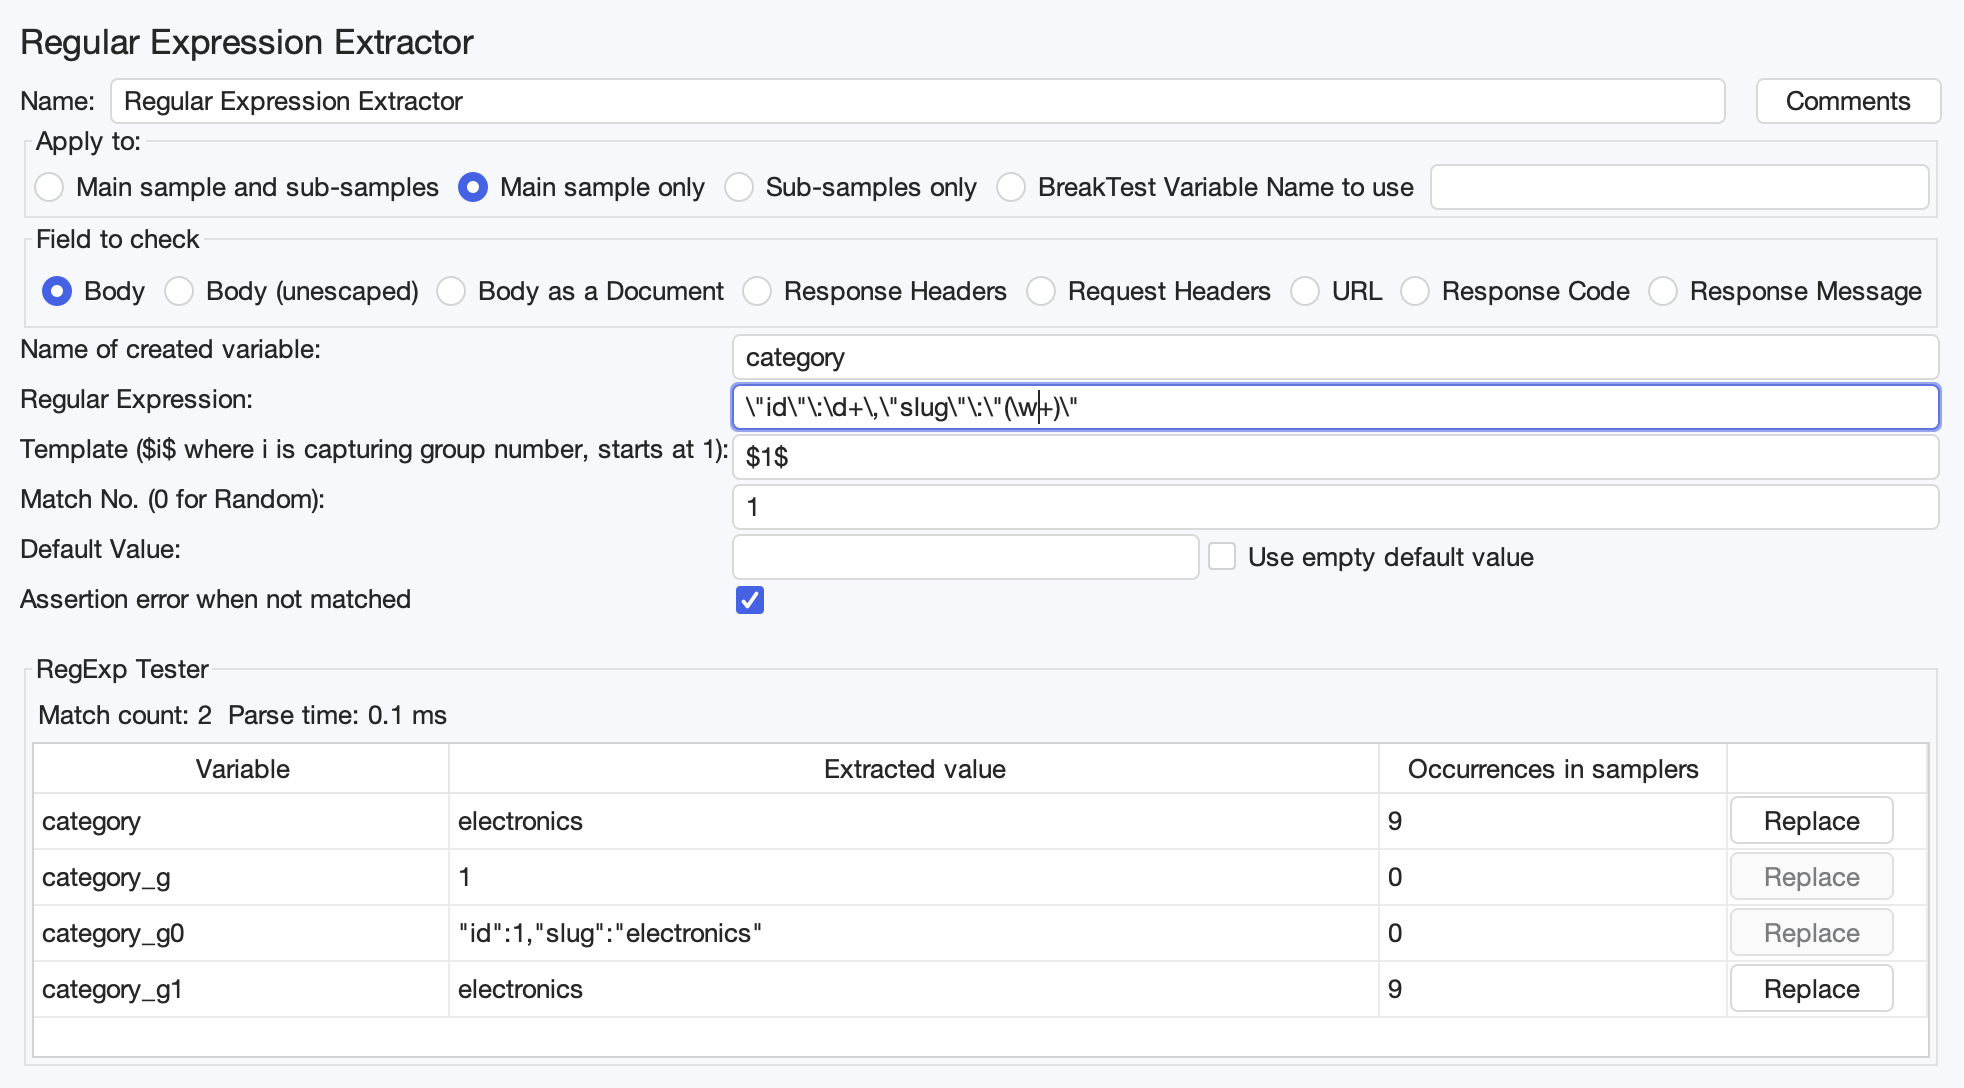
Preview extracted values and see how often they occur in samplers before replacing them with variables. Select the image to open it full size. -
Create extractors and assertions from responses
Select response text or headers and create the corresponding element directly, with undo support.
Select any part of the response text in the results view, then right-click to add the selected text directly as an assertion or use it to start a regular-expression extractor. This works with response bodies and headers, so the exact text you are inspecting becomes the starting point for a check or extraction.
Creating checks and extractors directly from a selection can significantly speed up scripting: you can work from the response in front of you without copying text, navigating the test tree, and creating each element manually.
These actions participate in the normal undo history, so you can revert a newly created assertion or extractor while refining the plan.
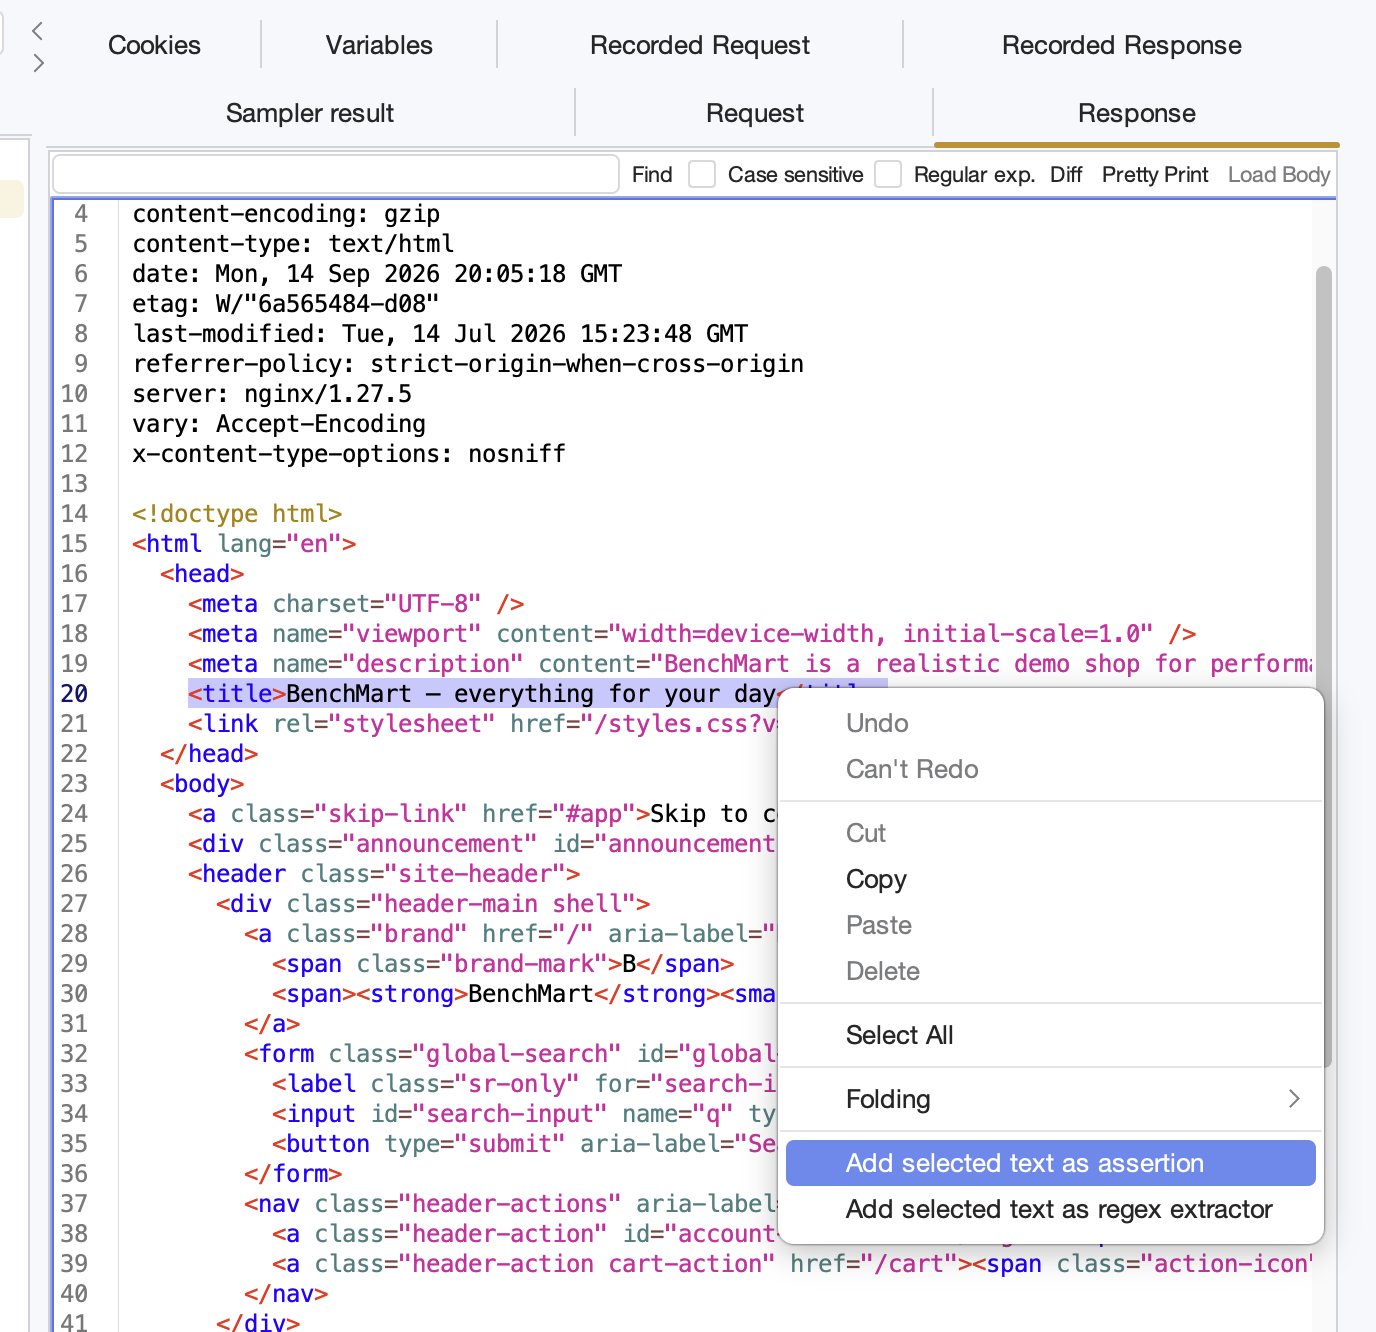
Select part of a response and right-click to create an assertion or start a regular-expression extractor directly. Select the image to open it full size. -
Structured If/While conditions
Condition rows with all/any matching instead of expression strings.
If and While Controllers accept structured condition rows for operands, operators, and values, combined with all-must-match or any-must-match. Operators are selected from a readable list that includes equality, contains, starts/ends with, regular expressions, numeric comparisons, and existence checks.
This makes conditions much easier to build and understand than the legacy approach. In JMeter, branching conditions are commonly written as expression strings such as
${__jexl3(…)}; those are harder to review, easier to break, and can silently evaluate to false after a typo.Legacy expression strings remain supported, so existing plans run unchanged.
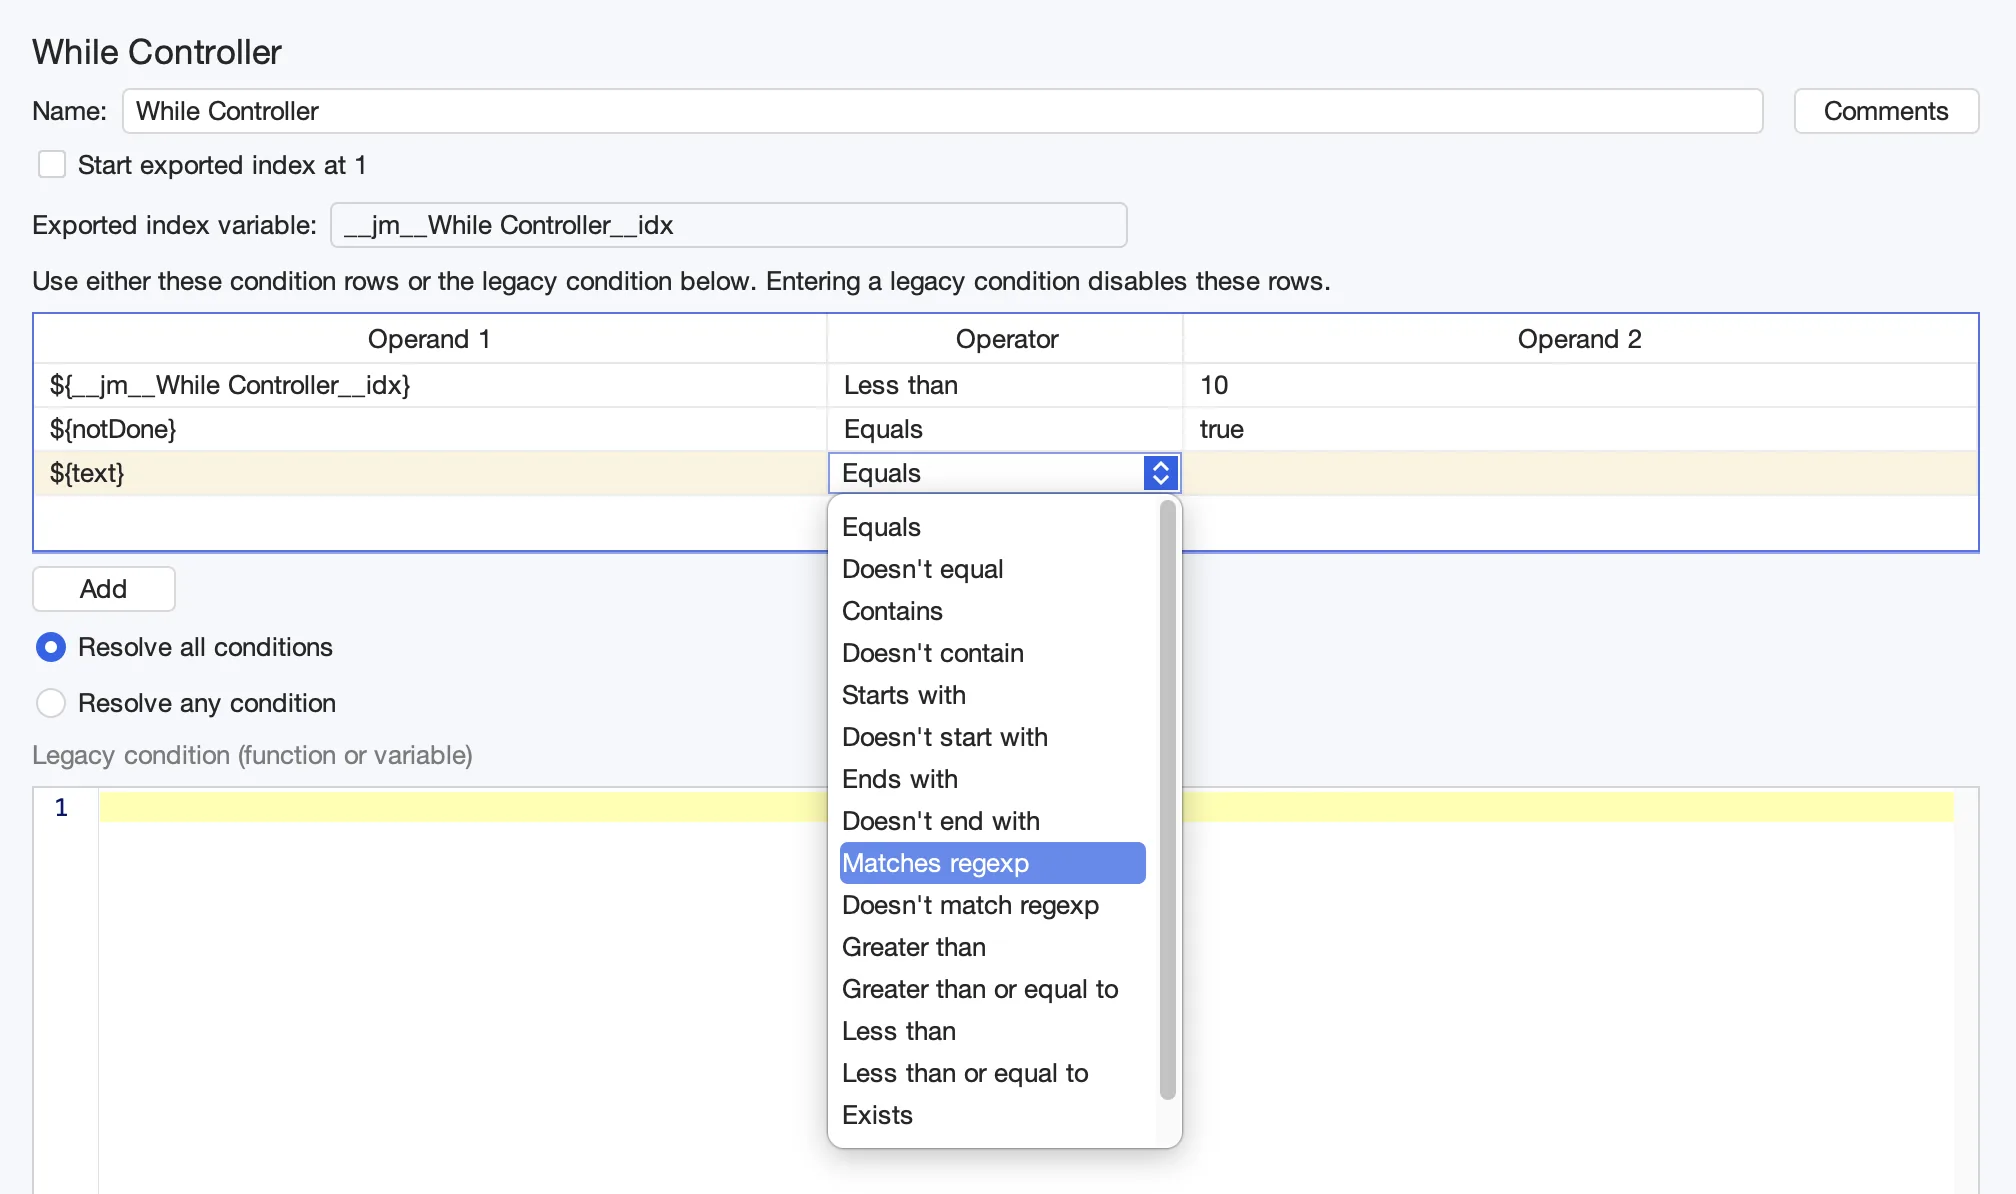
Build While and If logic from clear condition rows and choose operators from the list instead of writing a legacy expression by hand. Select the image to open it full size. -
Extractors can fail the sampler
All eight extractor types can fail loudly when nothing matches.
Boundary, CSS/HTML, Regex, XPath, XPath2, JSONPath, and JMESPath extractors have a fail-on-no-match option. When enabled and no value is found, the sampler is marked failed and the result names the extractor that produced no match.
In JMeter, a failed extraction leaves the variable at its default value and the test continues. A broken session-token extraction therefore produces a run in which every subsequent request nominally succeeds against error pages. The failure is only discovered during result analysis, after the run.
Failing at the extraction point identifies broken correlation immediately and names the exact element to fix.
-
Random CSV order & data preview
De-correlate test data; preview variable assignments before running.
CSV Data Set can read records in random order, with header behavior preserved. JMeter's sequential-only reading feeds every run the same records in the same order, which warms caches identically and introduces a hidden correlation into run-to-run comparisons. Random order removes this without maintaining pre-shuffled copies of data files.
The GUI additionally previews how the first records map onto variables before a run, so delimiter and column-mapping errors are caught during configuration rather than after a failed test.
-
Predictable loop indexes
Explicit index behavior with exported index variables.
Loop and While Controllers expose index behavior as an explicit option and export the index under a configurable variable name. In JMeter, the starting value and variable name of loop indexes were undocumented implementation details, which made scripts that derive data from iteration counters fragile across versions.
-
Redesigned HTTP Request with embedded headers
A clearer sampler layout with request-scoped headers built directly into it.
The HTTP Request sampler has been redesigned around the settings you use most. Method, protocol, host, port, and path form one clear request row; parameters, headers, body, files, advanced settings, and recorded evidence each have a dedicated tab. Request options and timeouts stay visible alongside the editor.
Headers that apply to a single request are configured directly on the sampler, with the number of configured values shown on the tab. Child HTTP Header Manager elements migrate automatically; Header Managers at higher scopes continue to apply for genuinely shared headers.
In JMeter, a request-specific header requires a child Header Manager element, so realistic plans accumulate hundreds of single-purpose manager nodes that obscure the actual test structure.
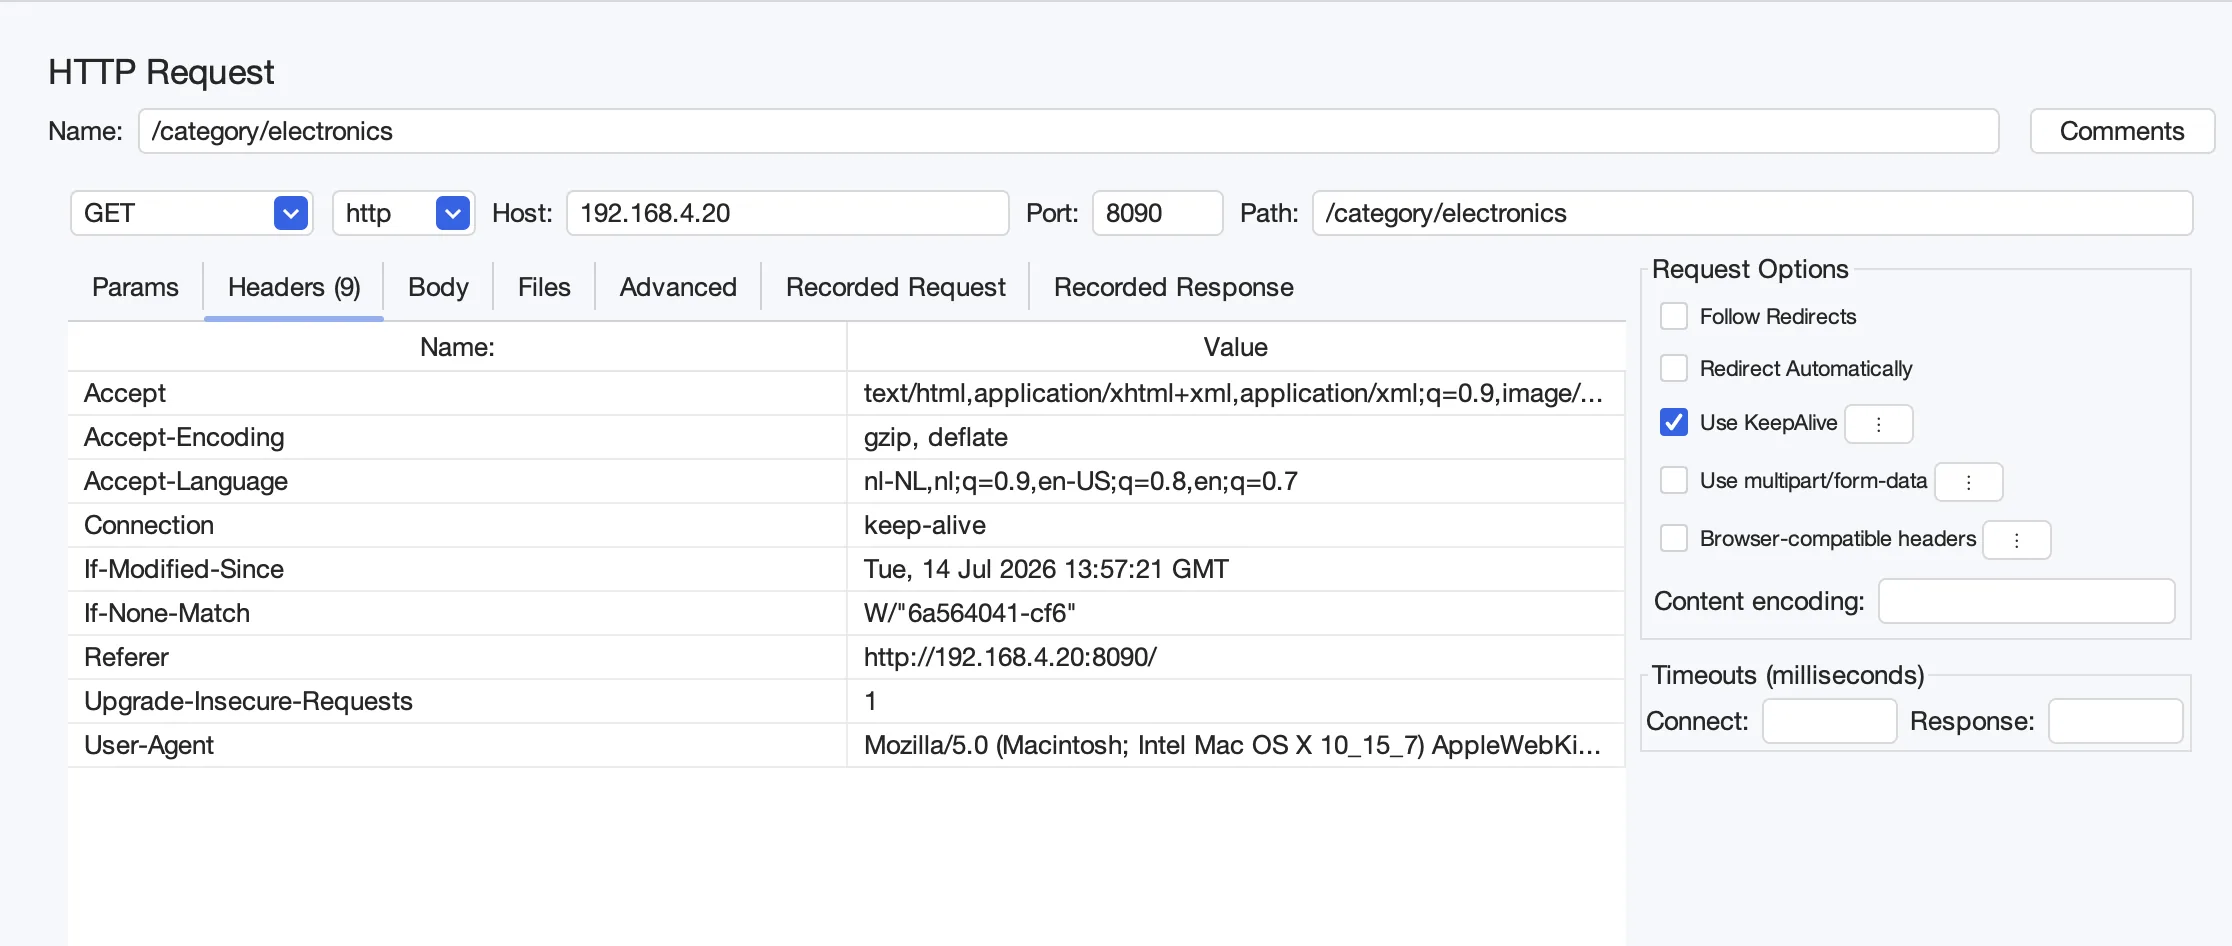
The redesigned HTTP Request sampler with nine request-scoped headers embedded directly in the request. Select the image to open it full size.
Recording & import
-
Record HTTP, WebSocket, and SSE together
Turn captured browser traffic and streaming conversations into native test elements.
The redesigned proxy recorder forwards live traffic independently of replay and captures HTTP requests, WebSocket handshakes and messages, and Server-Sent Events. It generates native connection and send steps, preserving recording evidence when the JMX archive is saved and reopened.
A finish-recording wizard lets you review hosts, failed captures, transaction grouping, think times, and predefined correlations before import. Overlapping requests are grouped, and transaction boundaries follow the names set while recording.
Incoming messages and events remain evidence for scripting; the recorder does not infer application-specific assertions or event handlers.
-
Official BreakTest HAR Recorder
Install it from the Chrome Web Store, record a HAR, and name transactions while you click.
The official BreakTest HAR Recorder is available from the Chrome Web Store. It runs in Chrome's side panel, records a browsing session as a HAR file, and assigns every request to a named transaction while recording.
Given a start URL, it opens a blank tab, attaches the recorder first, and then navigates, capturing the initial document request and all resources it loads. During the session, the next transaction name (for example
02_Login) is typed into the panel; each request is assigned to the transaction active when the request started. A live list shows completed requests, response bodies are captured for later comparison, incognito/private windows are supported, and the browser cache can be disabled for cold-cache recordings.The exported HAR includes the transaction names, so File → Import HAR generates Transaction Controllers with recorded think times directly. Recording with DevTools, by contrast, provides no transaction concept, misses the requests issued before the Network panel is opened, and depends on manual export settings.
Chrome users can install the official extension directly from the Web Store and receive updates through Chrome. The recorder has its own release lifecycle rather than shipping inside BreakTest. HAR Import provides shortcuts to the Chrome, Edge, and Firefox extension listings.
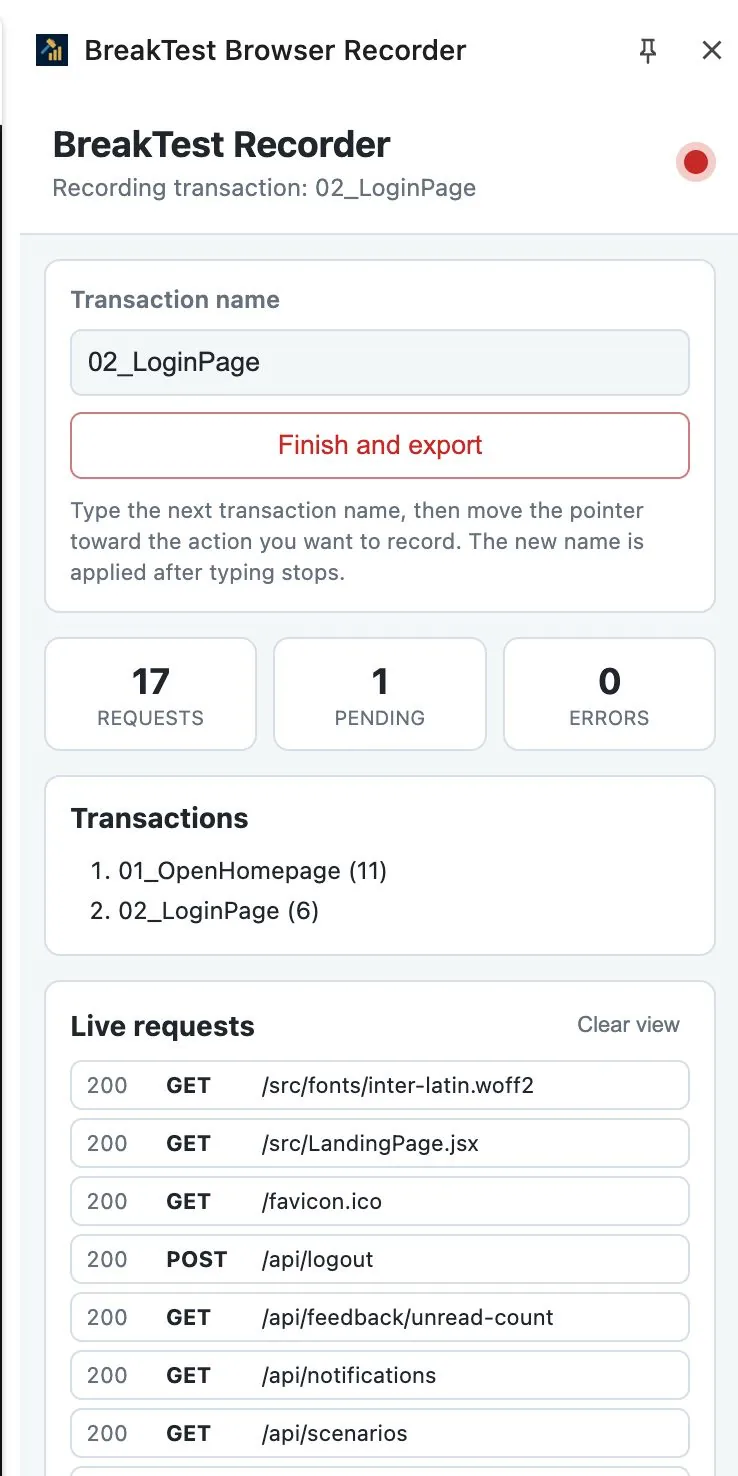
The recorder while capturing a named user journey and its live requests. Select the image to open it full size. -
HAR import wizard in the GUI
File → Import HAR: pick hostnames, group requests, generate a full plan.
BreakTest imports HAR files directly via File → Import HAR. The first step lists every recorded hostname, groups related subdomains, and shows how many requests each host contributed. Select an entire domain group or individual hosts, making it easy to keep the application and API traffic you care about while excluding advertising, analytics, and unrelated third-party resources.
The wizard then groups requests into transactions using recorded idle gaps or the names recorded by the Browser Recorder, optionally ignores recorded error responses, adds request indexes, and detects dynamic URLs. JMeter has no HAR import; turning a recording into a plan required external tooling.
Transaction delays can be recorded, fixed, random, Gaussian, or disabled. Think times accept JMeter variable expressions, with optional
ThinkTime,ThinkTimeMin, andThinkTimeMaxTest Plan variables, so pacing for the entire plan is adjusted in one place. The tree displays the resolved think-time summary next to each transaction and refreshes it when the variables change.The generated plan includes Transaction Controllers, Parallel Controllers for concurrent requests, HTTP Request Defaults, a Cookie Manager, assertions, and shared versus request-local headers, and it retains the HAR metadata required for recorded-vs-replayed inspection and AI repair. After import, only the new Thread Group is expanded.
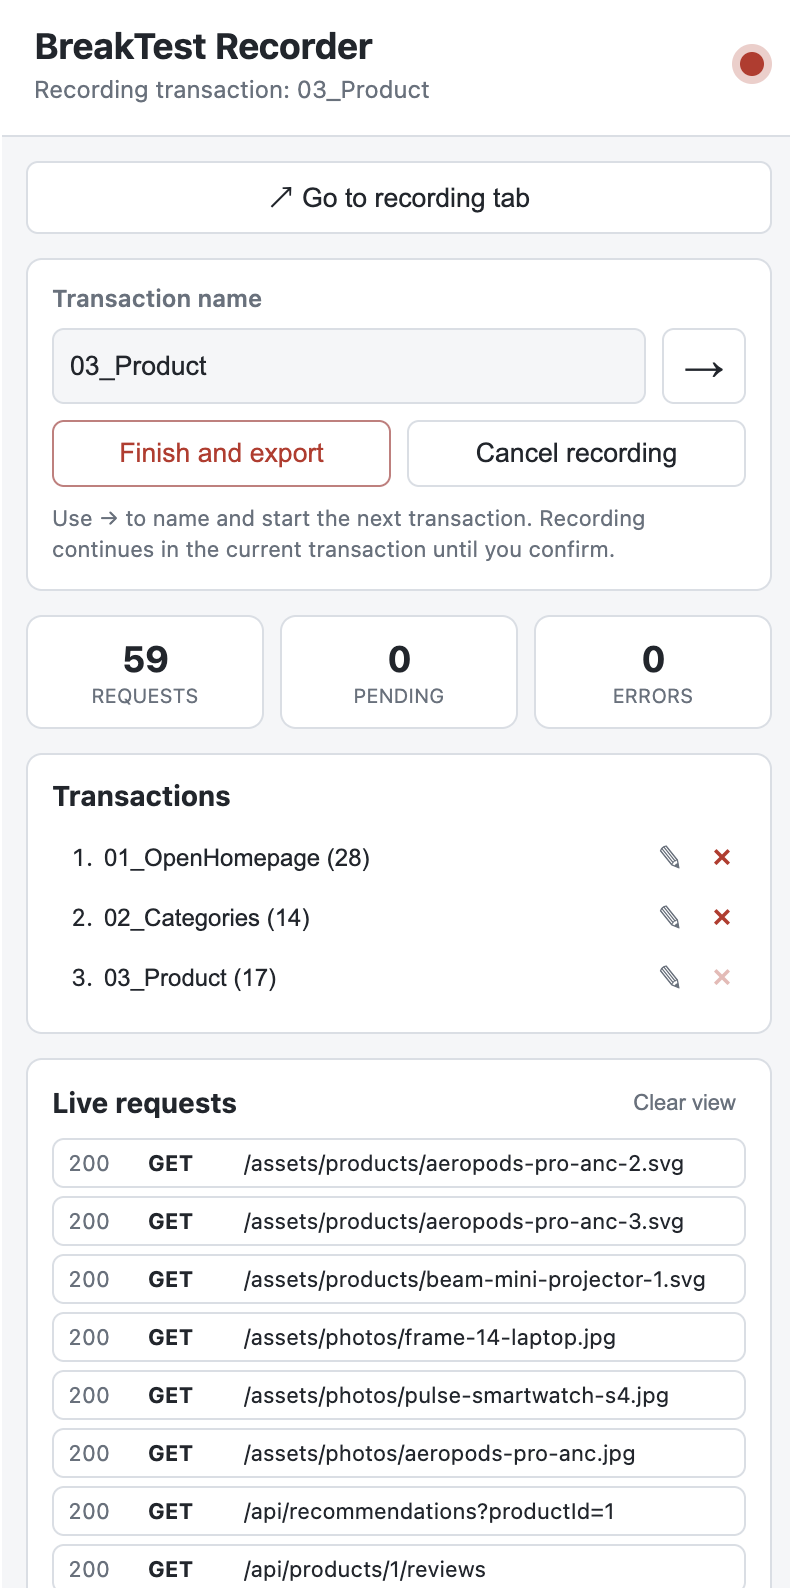
Record named transactions in the browser, then finish and export the HAR for import into BreakTest. Select the image to open it full size. -
Predefined correlation rules
Import a HAR, preview the dynamic values, and apply most correlation work in one guided pass.
Tools → Correlation Rules manages enabled rules and groups, remembers preferences across updates, and processes existing thread groups. Save custom rules from Regex, JSONPath, Boundary, CSS, XPath, XPath2, and JSON JMESPath extractors; import or export rules and share individual custom groups.
Review extracted values and target variables, then select exactly which requests receive replacements. Repeated identical captures are deduplicated, rules default to unlimited matches, and minimum captured-value length is configurable. Distinct competing values remain ambiguous rather than being silently selected.
Scans show progress, allow cancellation without applying partial results, and reuse parsed JSON documents across JSONPath rules. Matching accounts for recorded URL encoding.
BreakTest scans HAR imports for grouped predefined correlations by default. It finds values produced by earlier responses and reused in later requests, previews exactly which request values will become variables, and lets you review the rule groups before it adds the extractors and substitutions to the plan.
The built-in catalog covers common OAuth/OIDC, SAML, identity-provider, enterprise-application, web-framework, and generic JSON/REST flows. Repeated and chained values receive unique variables and the nearest valid preceding extraction, preserving the application's real data flow instead of attaching every extractor to the first possible response.
Create rules for your own application by saving an existing extractor as a custom correlation rule. Once you have configured an extraction, reuse it on later recordings instead of rebuilding the same correlation each time. Organize custom rules into groups and share them with your team.
Apply those rules while importing a new HAR or process the enabled rules after a new proxy recording. Review the matches and replacements, then apply them to the thread group. Reusing application-specific extractions makes repeat scripting much faster.
The practical workflow is much shorter: import the HAR, apply the matching correlation groups, and start with most recurring extractors already in place. Manual scripting and AI Repair can then focus on the application-specific exceptions rather than rebuilding familiar correlation patterns for every recording.
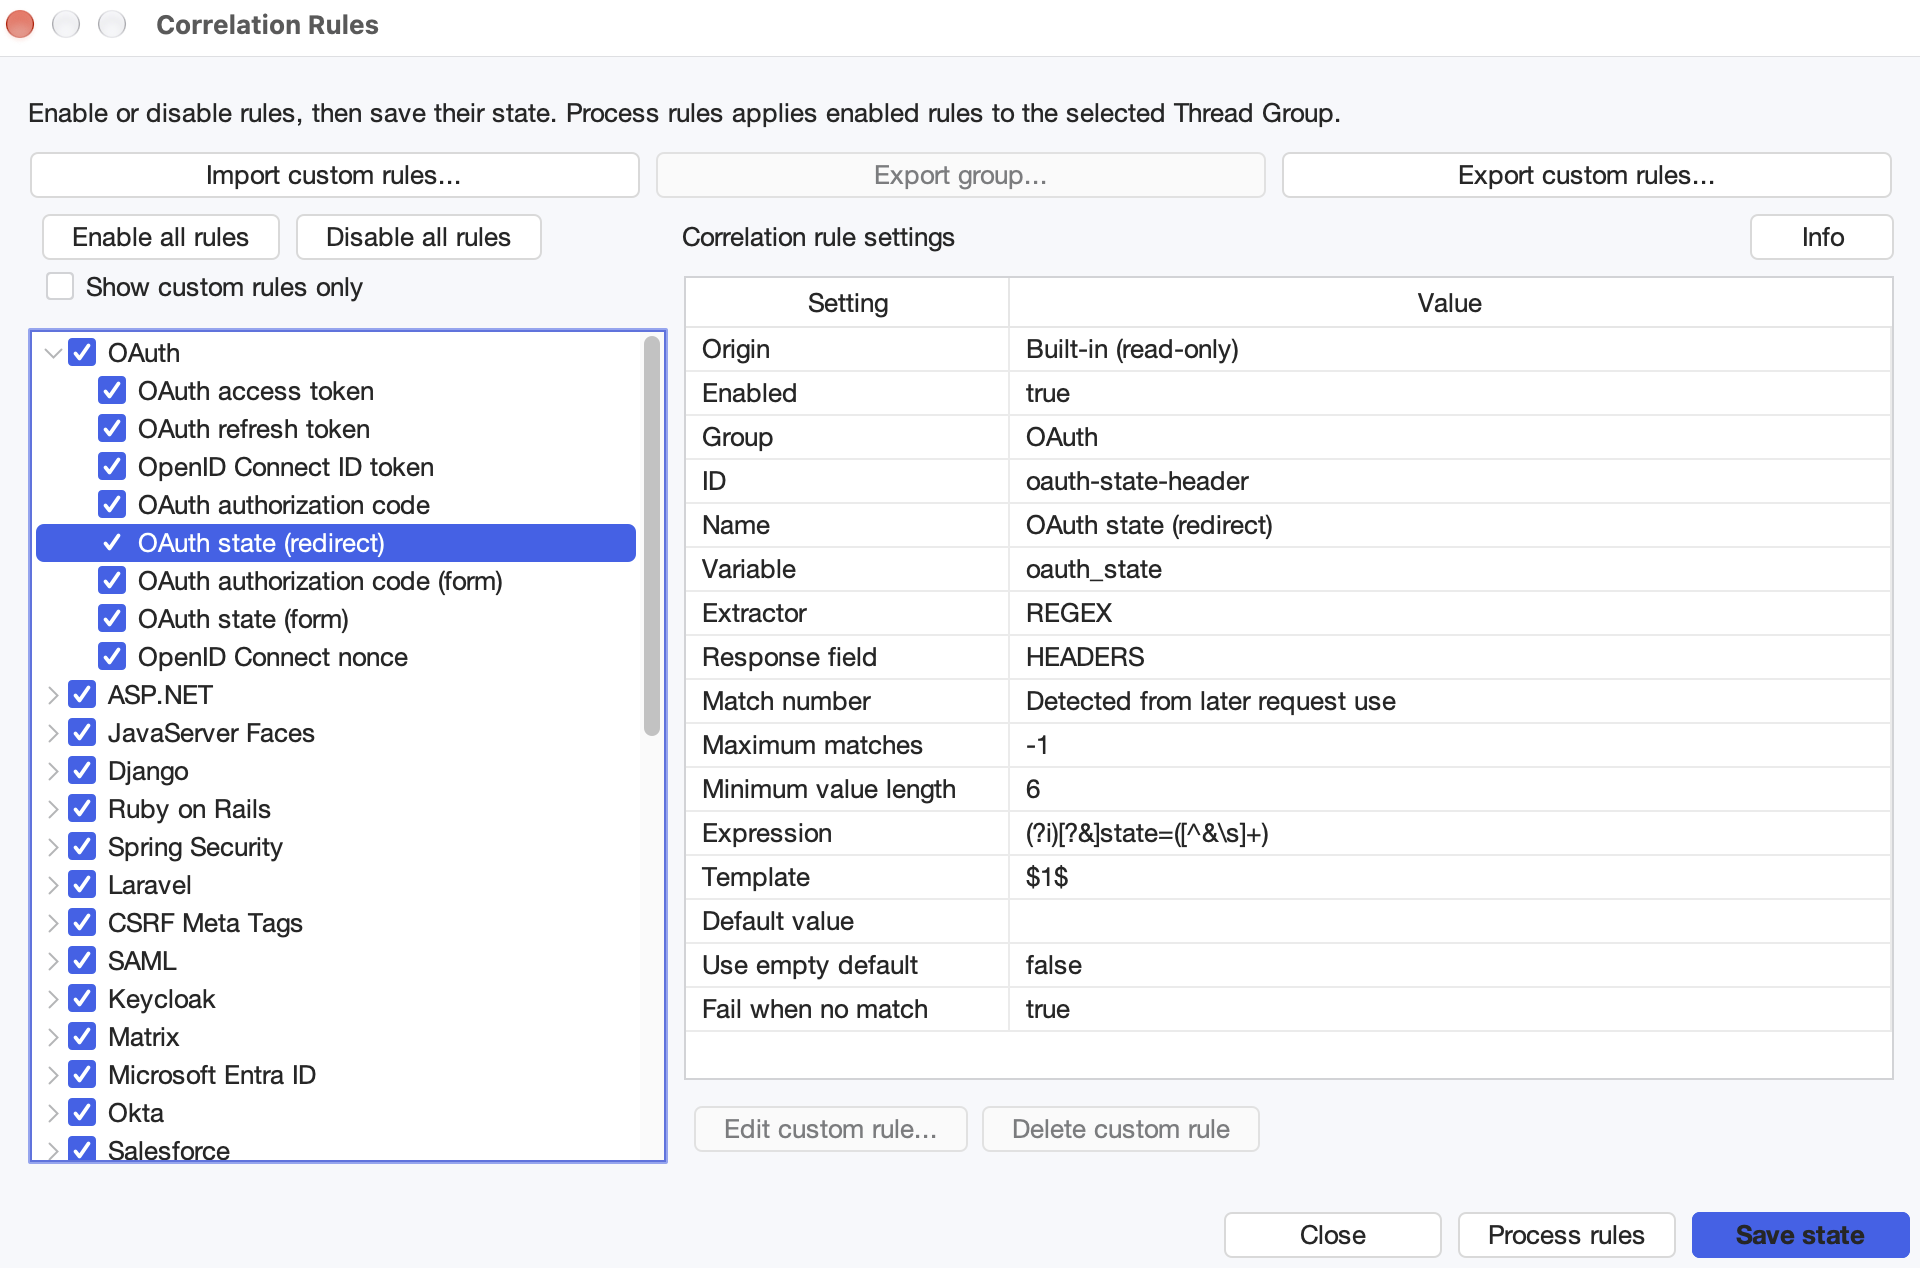
Manage built-in and custom rules, then process them against a recording to reuse your application’s correlations. Select the image to open it full size. -
Recorded vs. replayed, side by side
Imported scripts keep recording metadata for direct diffs.
Scripts created by HAR import keep a per-sampler reference to the originally recorded exchange. The results tree and the HTTP sampler editor can display the recorded request and response next to the replayed ones, with normalized formatting so the diff shows substantive differences, such as a missing header or an unsubstituted token, rather than formatting noise.
This directly answers the central question in correlation work: where does the replay deviate from the recording? In JMeter this comparison had to be assembled manually from the recording and a separate capture of the replay. Plain JMeter JMX also has no place to store the recording linkage, which is one of the reasons the BreakTest JMX variant exists.
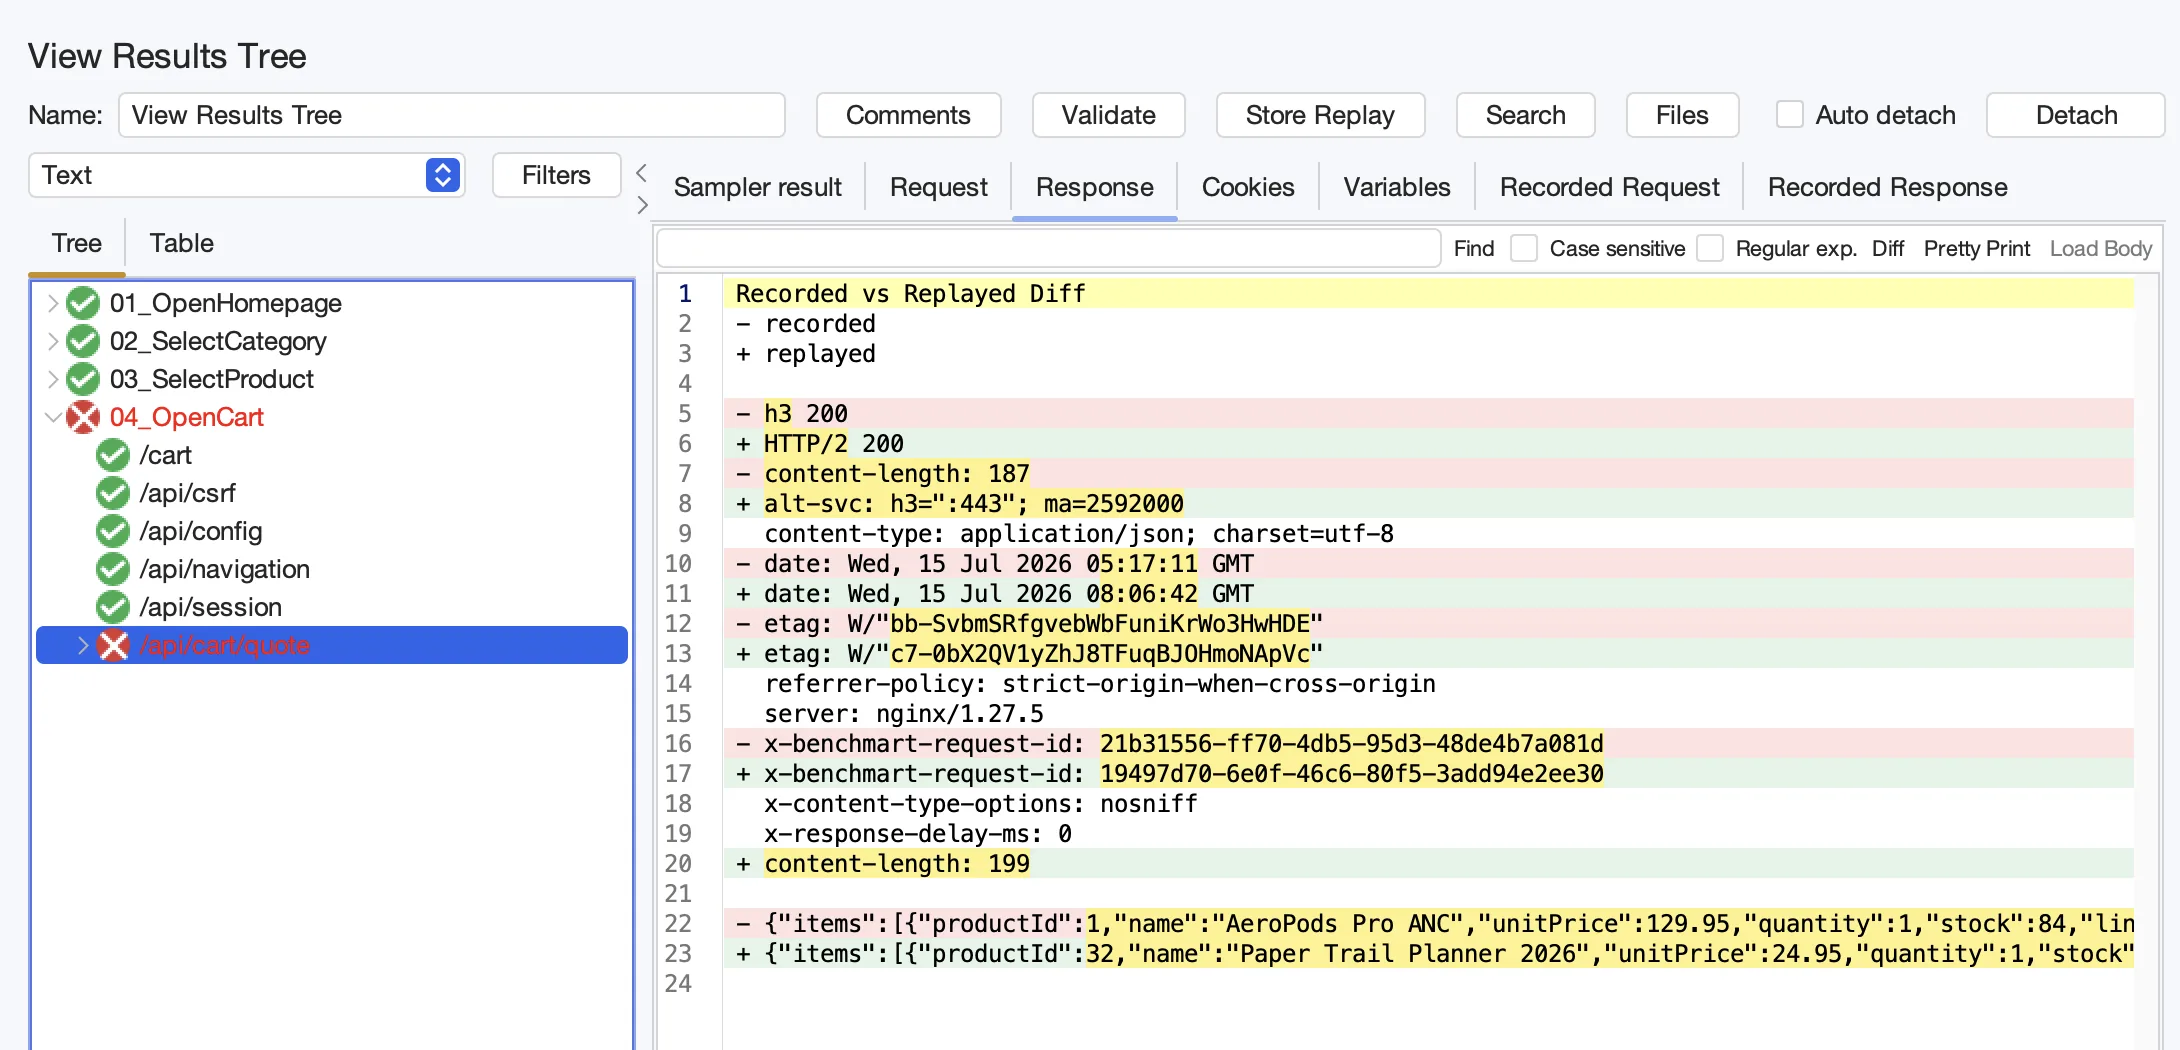
The recorded-versus-replayed diff exposes the exact values that need correlation instead of leaving you to compare separate captures manually. Select the image to open it full size. -
Recordings travel with the plan
JMX saves as a compressed archive that can embed the recording evidence.
BreakTest saves test plans as compressed archives (retaining the
.jmxextension) that contain the plan and its recorded request/response evidence in a single file. Entries are deduplicated, checksummed, and validated without extraction to the filesystem. Four retention levels control what is embedded: the full recording, recordings without static response bodies, recordings without static resources, or none.This keeps recording evidence attached to the plan as it moves through version control and between machines. Previously, the linkage broke as soon as the HAR file was separated from the JMX. Legacy plain-XML JMX files can be opened and migrated without changing the source until you save.
-
Store Replay as new evidence
Promote the latest replayed exchanges to the plan's recording baseline.
Store Replay takes the most recent replayed request/response for every resolved sampler in View Results and stores it as the plan's recording evidence, with the same retention levels as HAR import.
Recorded baselines lose value as the application changes. Updating the baseline from a verified replay keeps recorded-vs-replayed comparisons meaningful across application releases without repeating the browser recording.
Results & debugging
-
Inspect requests as structured data
Raw, Parsed, and Parsed Diff views make request differences easier to understand.
Parsed request views display query parameters, headers, and form fields in aligned tables. Parsed Diff compares recorded and current values side by side and distinguishes added, removed, unchanged, and unavailable fields.
Repeated parameters remain separate and malformed encodings remain distinguishable. Raw bodies support pretty printing, text comparison, and a larger modeless viewer, so you can investigate a request without losing your place.
-
Live transaction progress and immediate results
Watch running samplers and transactions; receive completed samples immediately.
View Results Tree shows running transactions and samplers with elapsed timers, replacing them with completed results as they finish. Each completed sampler reaches listeners immediately instead of waiting for the entire transaction.
Transactions retain running totals and lightweight links rather than every child response body for their full duration. This reduces retention during long transactions while preserving the visible hierarchy. One reporting model replaces the former Generate parent sample choice.
-
Keep polling out of performance metrics
Ignore successful polling samples while keeping failures visible, without a script.
Choose Included, Ignore on success, or Ignore always from the sampler header. The policy runs after post-processors and assertions, so successful polling can be excluded while connection errors, failed responses, and assertion failures remain visible with Ignore on success.
Ignored results do not contribute to listeners or transaction totals. Their waits still count in wall-clock transaction timing; use Sum child sampler times when those waits should be excluded. Ignore always also hides failed samples from the transaction’s failure status.
-
A results tree built for debugging
Endpoint, TLS, cookies, variables, binary detection, jump-to-source.
The Variables tab filters immediately by literal, case-insensitive text in variable names or values. Double-click a cell to inspect its full value, or clear the search to restore all rows.
The redesigned Results Tree keeps the request tree and the debugging data in one view, so you spend less time opening listeners, auxiliary samplers, and separate panes. Select a sample to inspect its summary, request, response, cookies, variables, and recorded request or response without leaving the tree.
Response output combines the protocol and headers with the body, detects text versus binary content, and supports Pretty Print for readable JSON or XML. Diff mode makes changes between responses visible directly in the viewer, which is especially useful when tracking down correlation and replay issues.
Each sample also exposes endpoint and TLS metadata, cookies sent and received, and the JMeter variables and user parameters available at that exact moment. Richer summary information and jump-to-source make it faster to understand a failure and return to the test element that produced it.
In JMeter, this information was partially available at best. TLS and endpoint details were absent, variable state required a separate debug sampler, and locating the producing element in a large tree was a manual search.
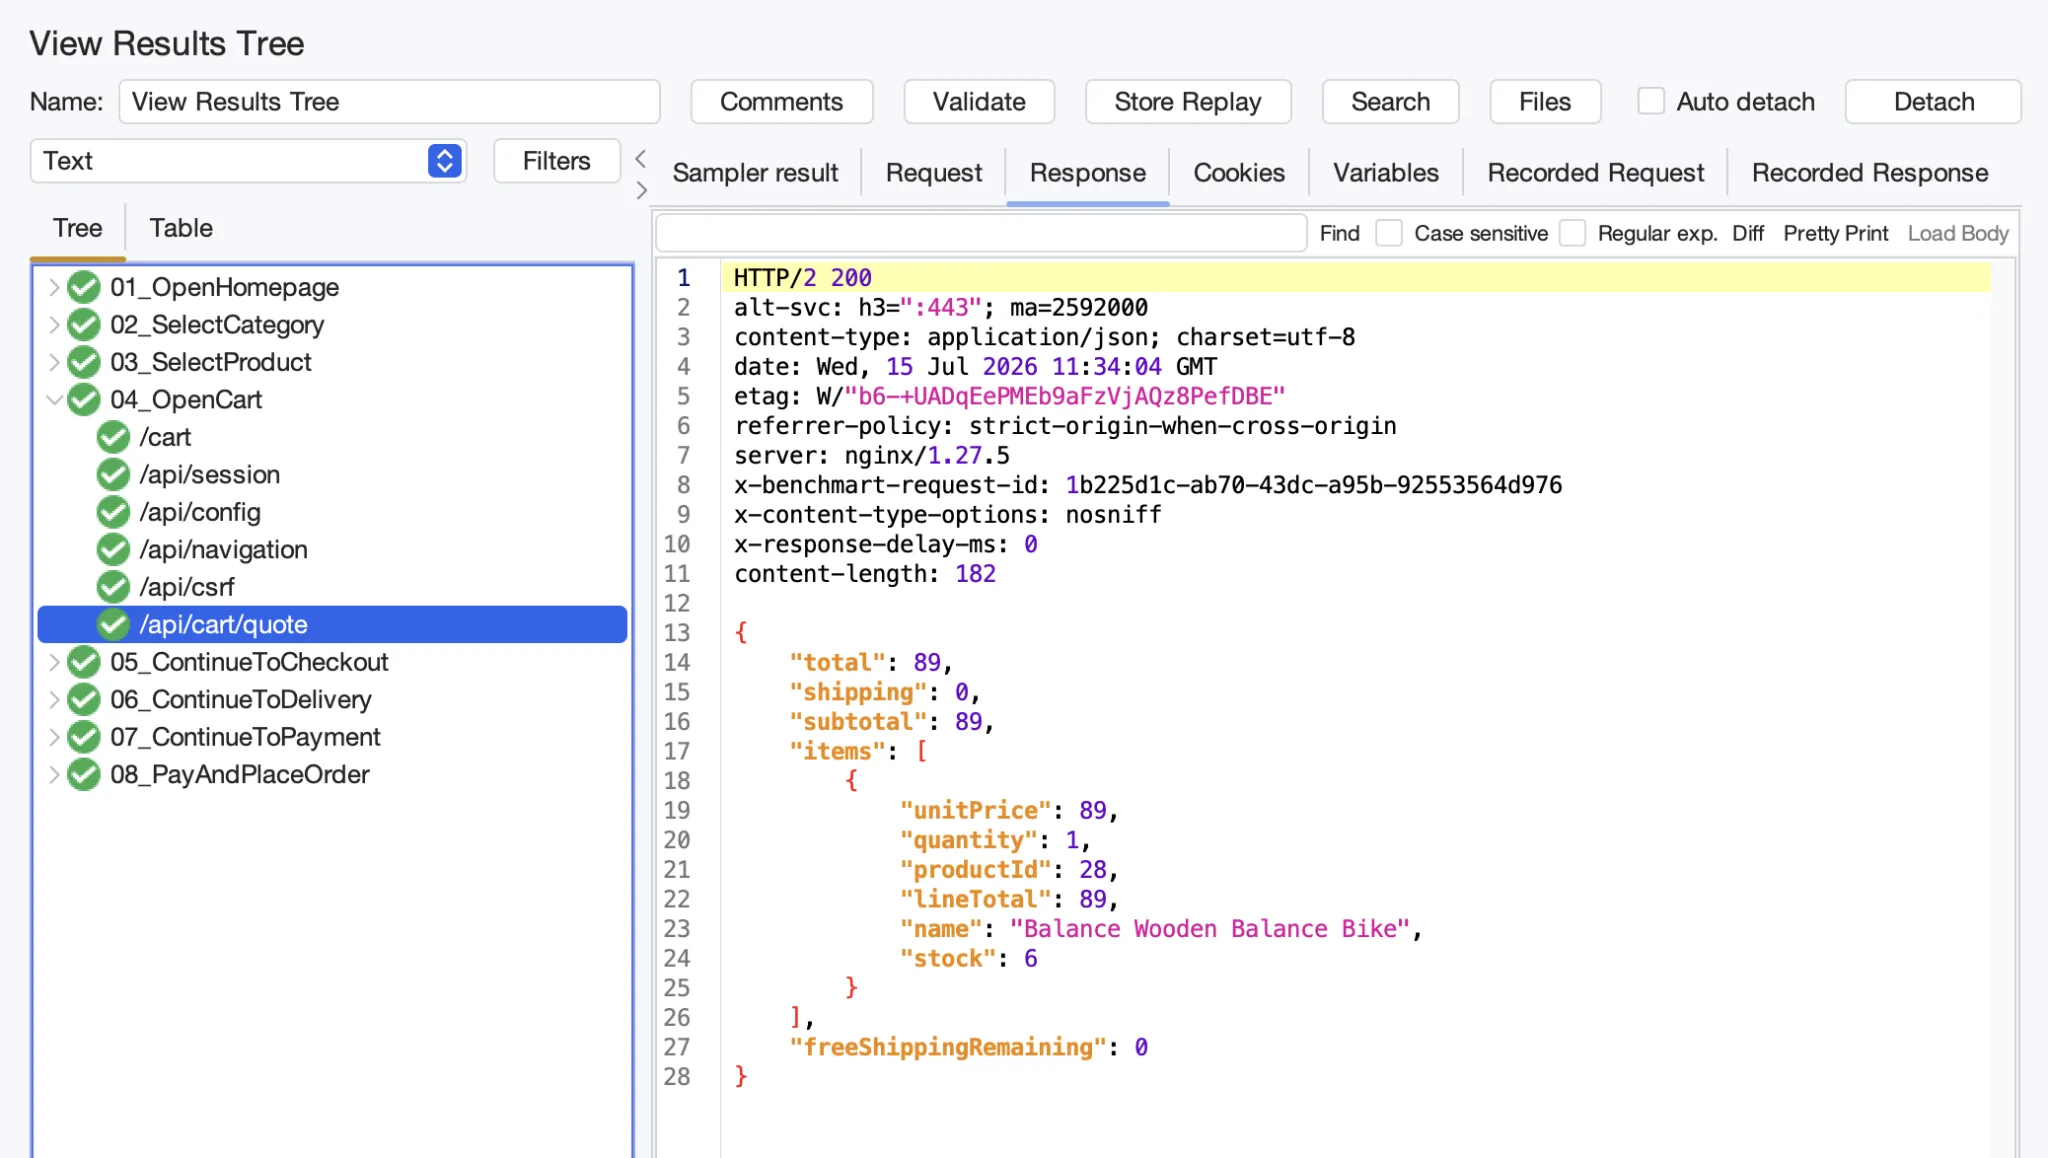
Keep the visual request tree, combined response output, Diff, Pretty Print, cookies, and variables close together while debugging a run. Select the image to open it full size. -
View Results as a table
Tree or table layout, selectable columns, filtering, sorting.
Listeners remember tree/table layout, visible columns, autoscroll, and response-diff settings in the plan. Filter All, Errors, or Successes; flat listeners show transaction-level results by default, with Children available to include nested samples. The default retained-result limit is 2,500; lower it when inspecting large responses.
View Results has a Table mode in addition to the tree: timestamp, response time, latency, connect time, request/response sizes, thread group, thread name, label, and URL, with per-column visibility, numeric sorting, and full-value tooltips for truncated cells. Results can be filtered by thread group, thread name, or sampler label, including a context-menu action to filter to a selected thread. Scrolling and filters remain stable during live refresh.
The tree layout is suited to inspecting a single sample in depth; it is inefficient for scanning hundreds of samples or isolating one misbehaving virtual user. The table covers that second case, which JMeter addressed only partially through separate listeners.
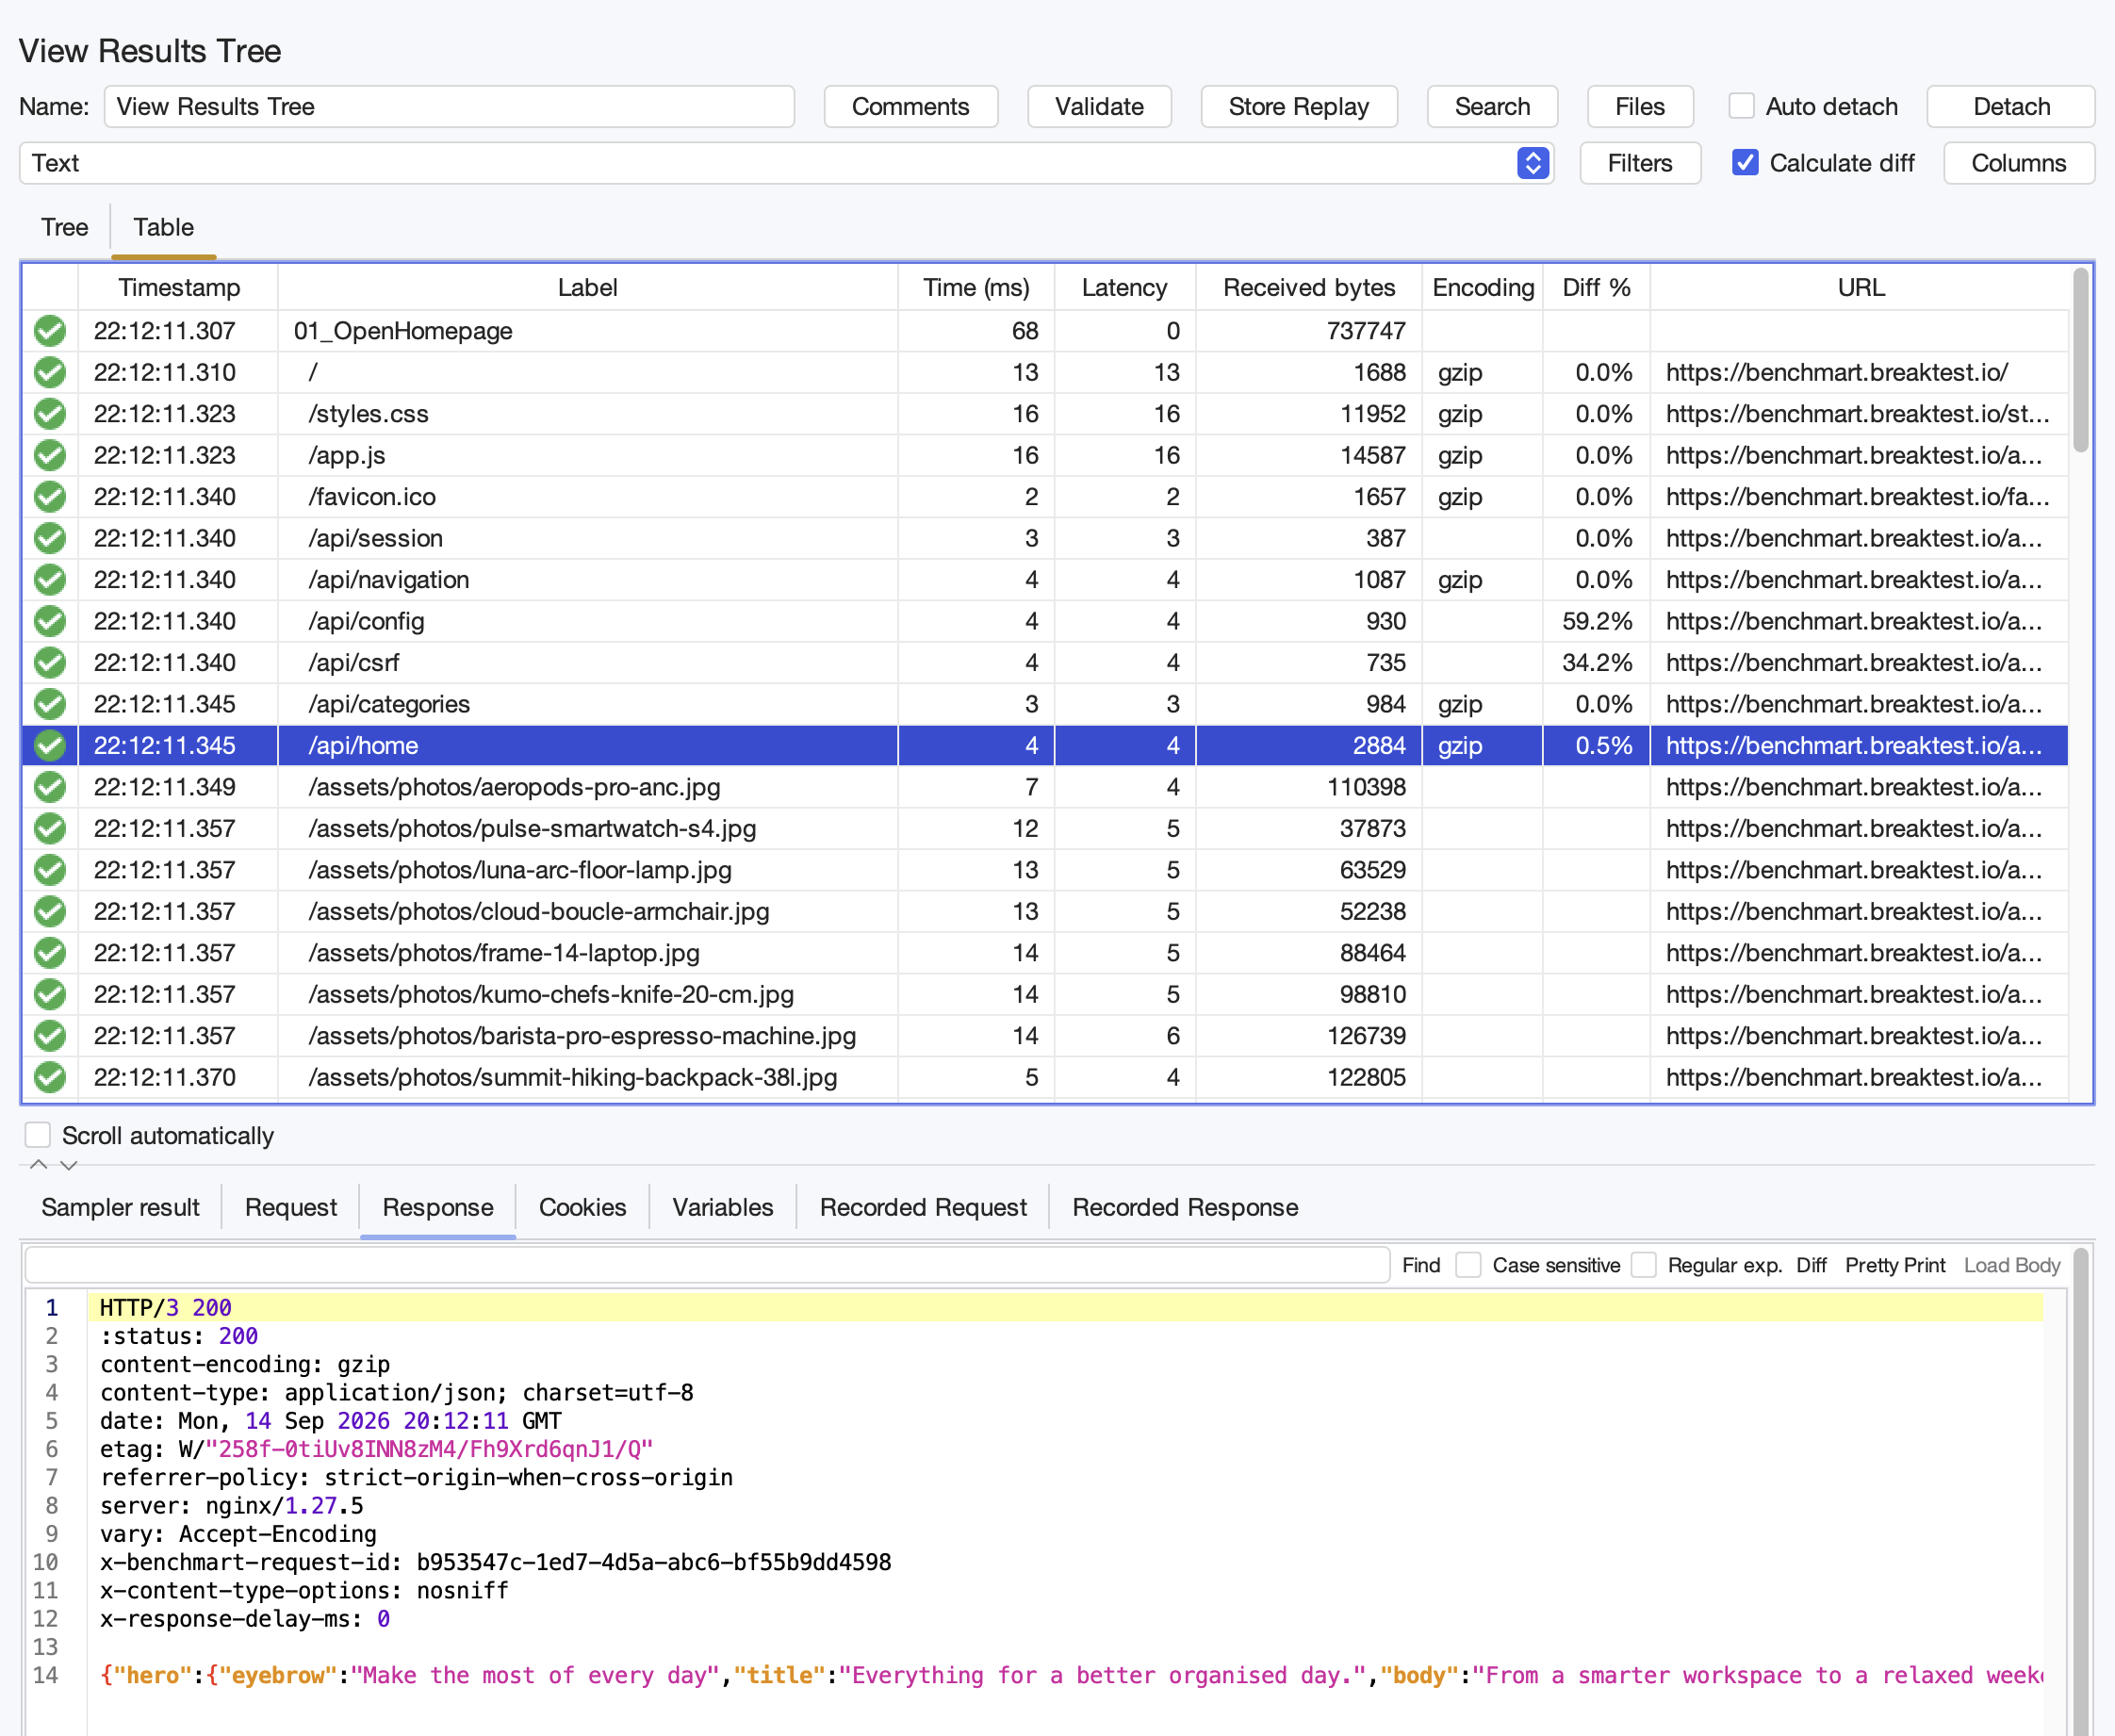
Scan samples in the table and inspect the selected response below, with timings, sizes, and differences visible together. Select the image to open it full size. -
Performance Report listener
Live aggregate metrics with configurable percentile columns.
The Performance Report listener is a complete live summary table for the run. Every transaction label gets samples, average, minimum, maximum, throughput, bandwidth, errors, connect time, and selected response-time percentiles, followed by a combined total row. Rows containing failures are highlighted in red so problems stand out immediately.
Choose exactly which columns the table displays, including median, P75, P90, P95, and P99. Percentile columns retain the response-time distribution data they need only while enabled, so the memory cost is paid only for the statistics you use. Error response times can also be excluded from timing metrics so fast failures do not lower the reported averages.
JMeter's aggregate listeners offered a fixed column set, kept full distribution data regardless of use, and included error samples in timing statistics without an option to exclude them.
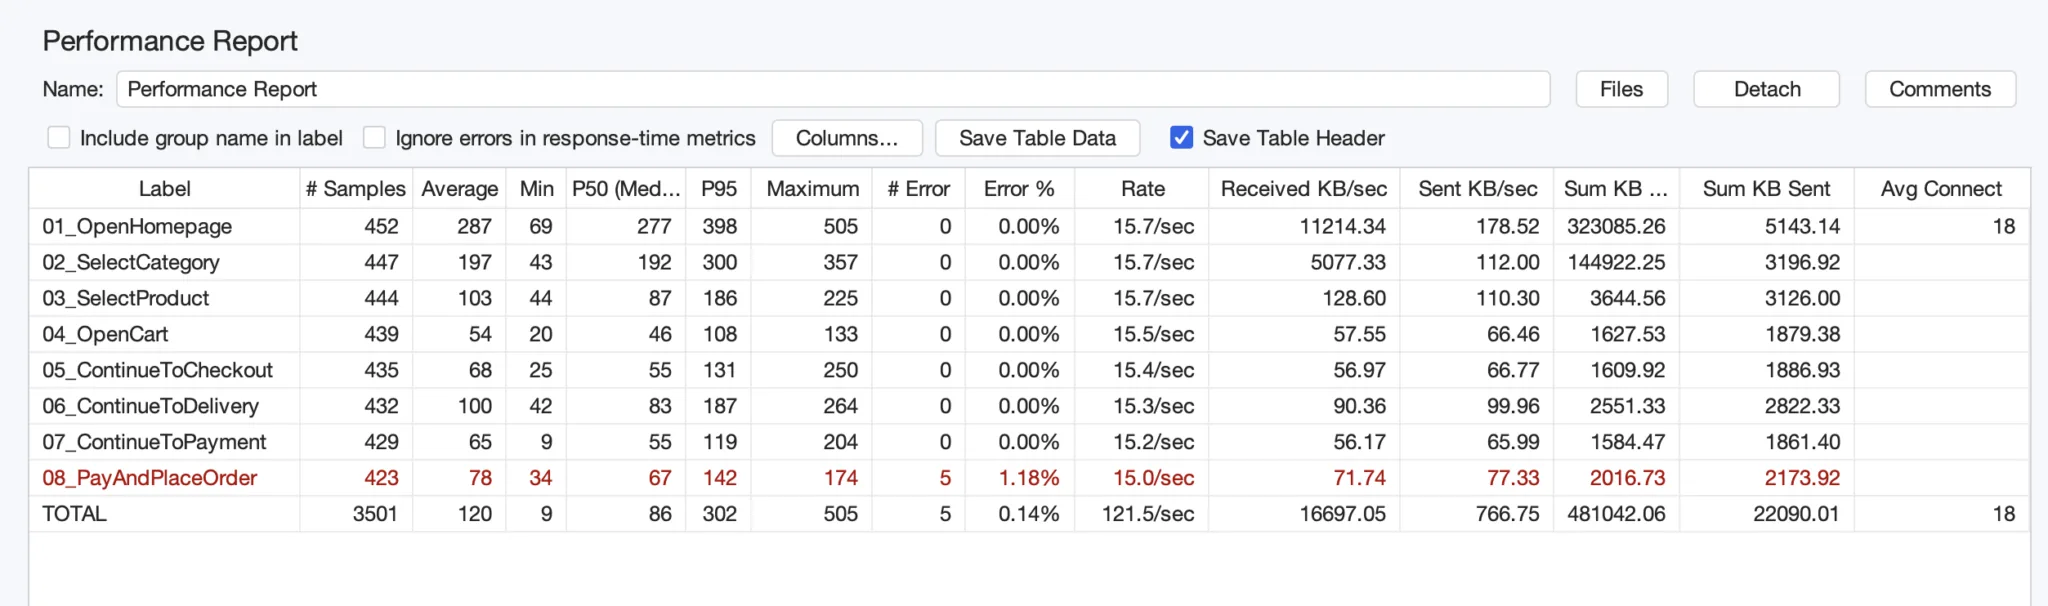
A complete live performance table with configurable columns and failures highlighted in red for immediate visibility. Select the image to open it full size. -
Detachable results & targeted validation
Detach View Results into its own window; validate exactly the selected thread group.
Validation opens an enabled Results Tree for the selected workload when available, follows running requests and transactions, and refreshes details on completion. Automatic opening can be disabled. When selection is outside a thread group, the validation shortcut reuses the last valid target for that plan.
View Results can be detached into its own window and docked back, so the test plan and results stay visible at the same time. That means less clicking between the sampler you are editing and the response you are debugging, whether the results window sits beside the plan or on a second display.
The detached view keeps the full results table and sample details together, including the JMeter variables captured when each request ran. Seeing extracted values such as IDs and correlation variables at the exact sample that used them makes scripting and debugging much more direct. Validation can also target exactly the selected thread group instead of the whole plan.
In JMeter, results viewers were fixed inside the main window, and validating a single thread group in a multi-group plan required disabling the others manually.
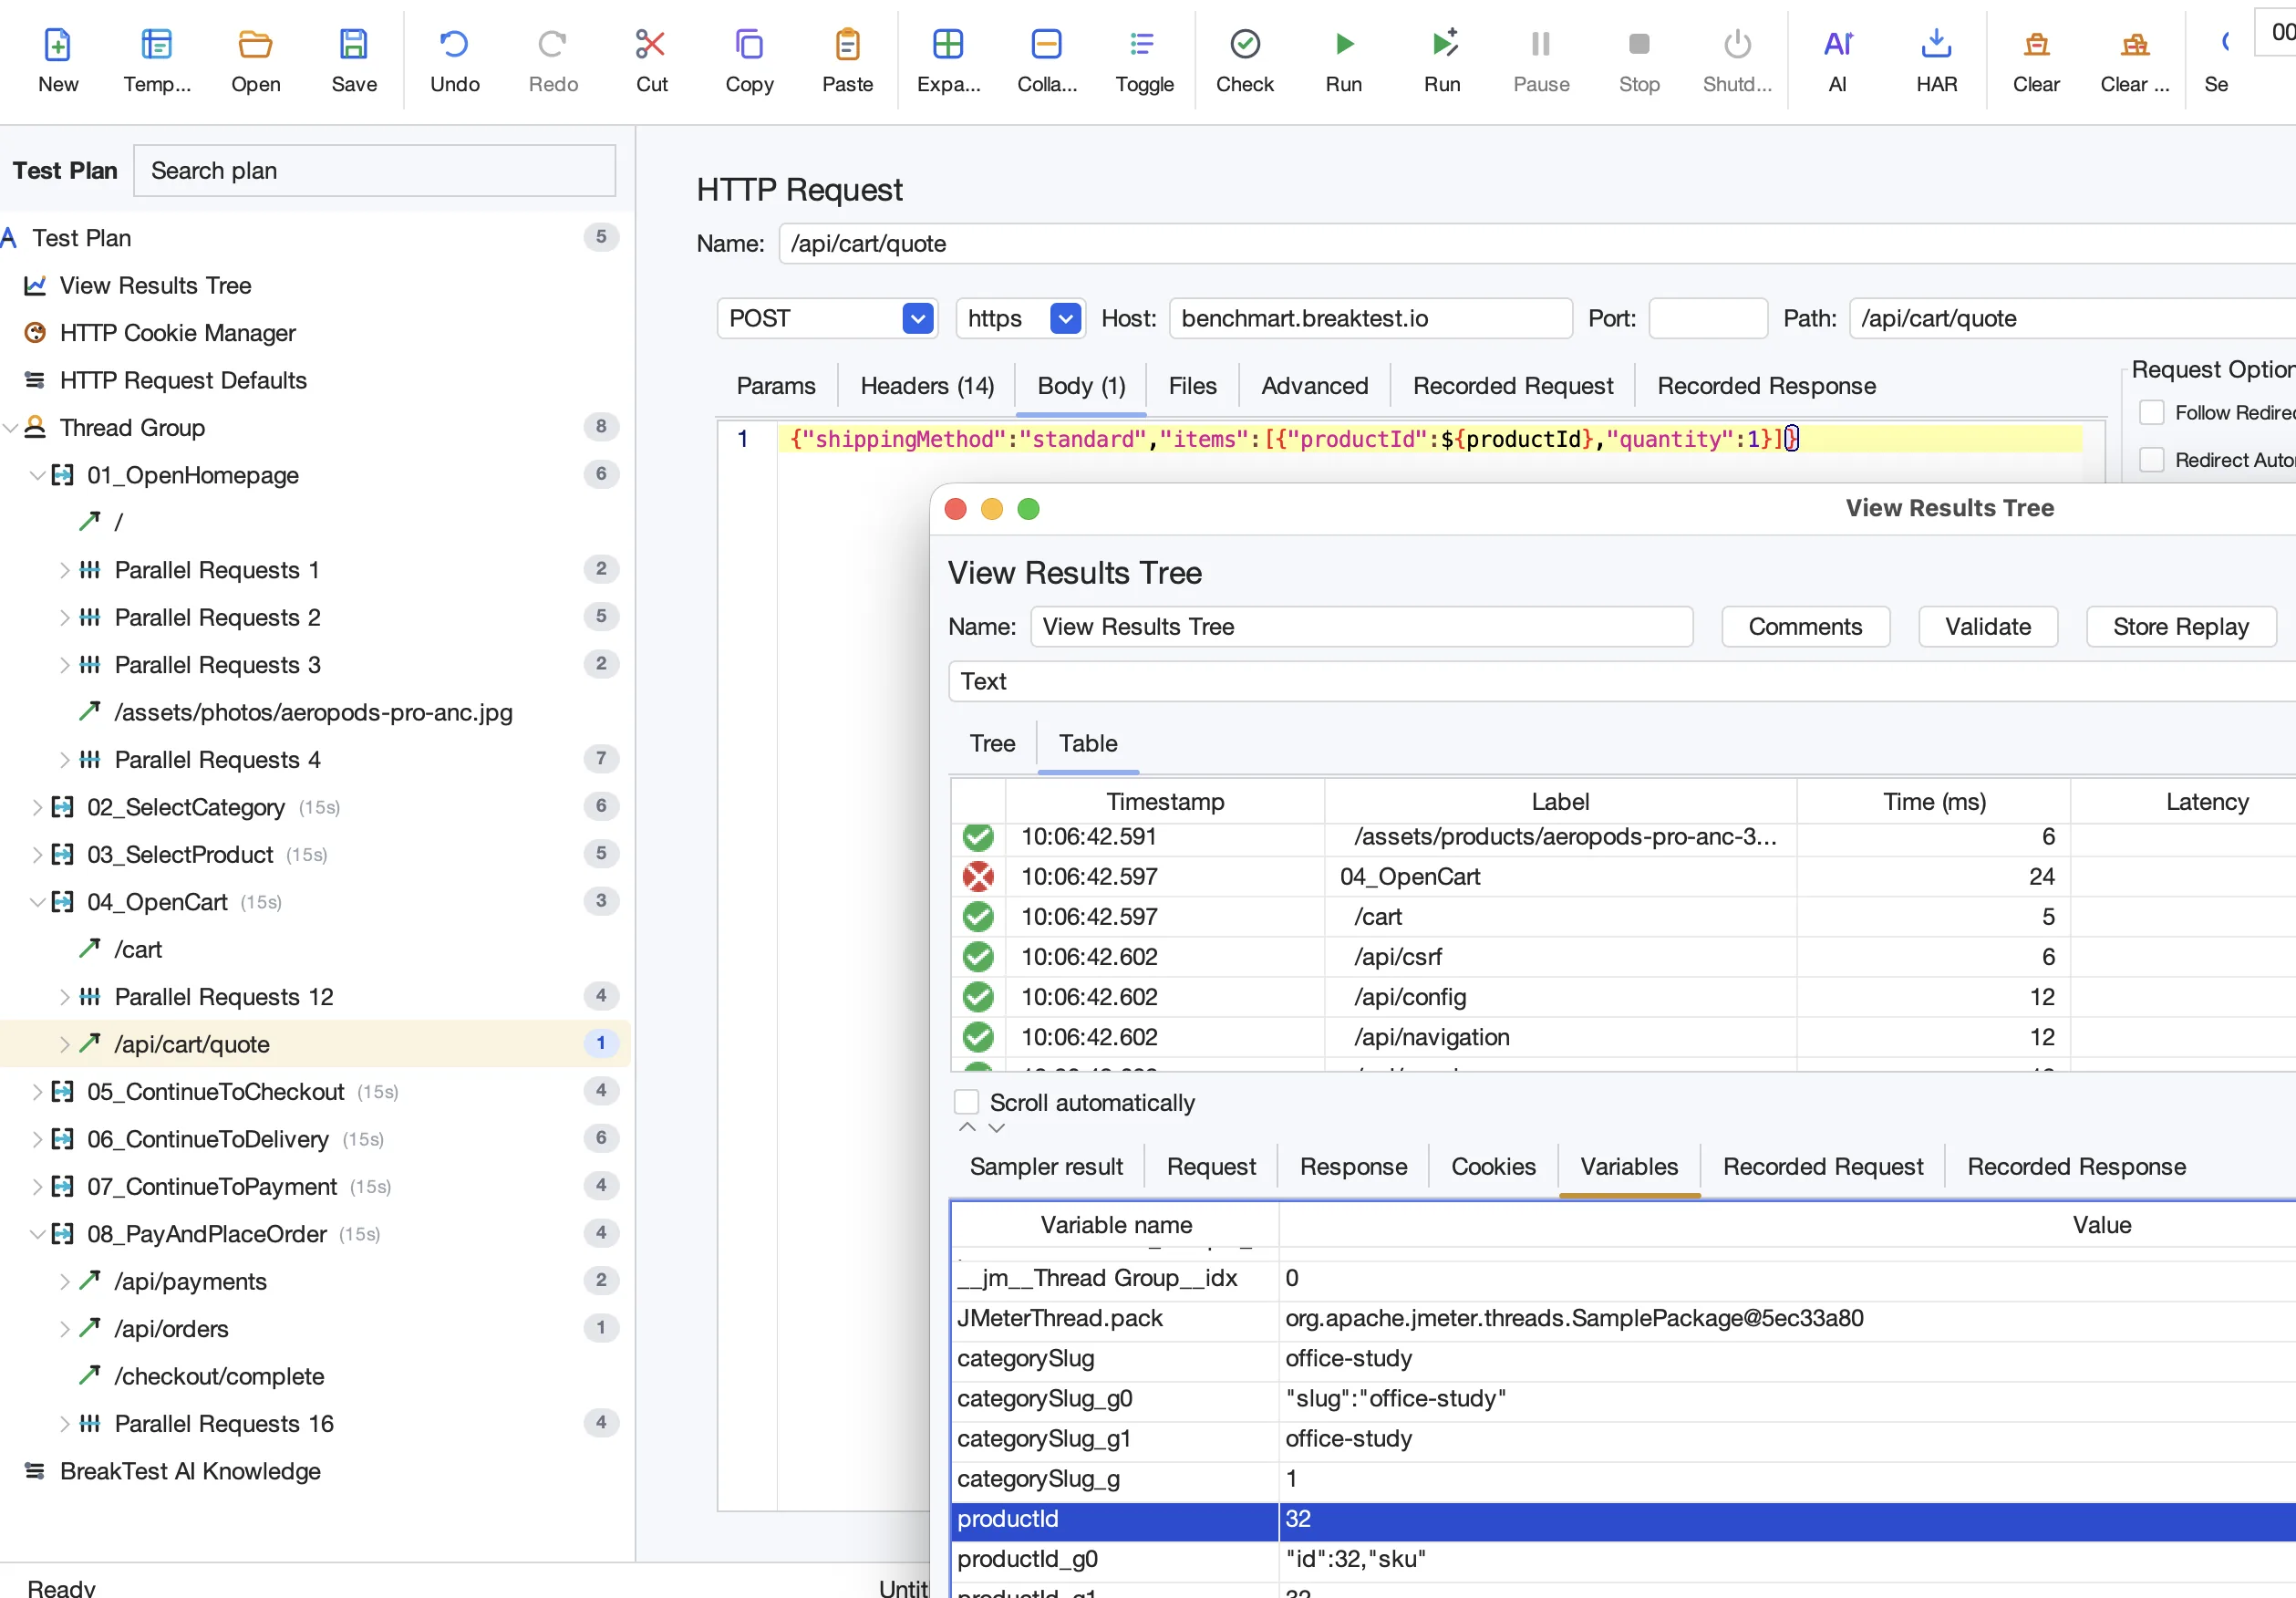
Detach View Results to keep the plan, samples, and each request's JMeter variables visible together while scripting and debugging. Select the image to open it full size.
GUI
-
A consistent layout for every test plan
Dedicated sections for scenarios, scripts, listeners, profiles, and reusable fragments.
Fixed top-level sections put Scenarios, Thread groups, Listeners, Profiles, and Test Fragments in predictable places. Shared Profile holds common configuration, and Non-Test Elements appears when recorders or supporting tools are needed. New elements are routed to the appropriate section.
Merging plans reuses those sections and resolves conflicting names while preserving scenario, profile, and module references. Module Controller provides Jump to and double-click navigation to its target.
-
A modernized desktop UI
FlatLaf light & dark themes, modern icons, denser and clearer layouts.
The GUI uses FlatLaf-based light and dark themes with consistent controls, modern SVG toolbar and tree icons, cleaner menu organization, and more compact editor layouts, so more of a test plan and its editor fit on screen at once.
Information density in the tree is improved with child-count badges on nodes, compact delay summaries next to Transaction Controllers, and value counts on the HTTP Request's Params, Headers, Body, and Files tabs. Configuration is visible without opening each node.
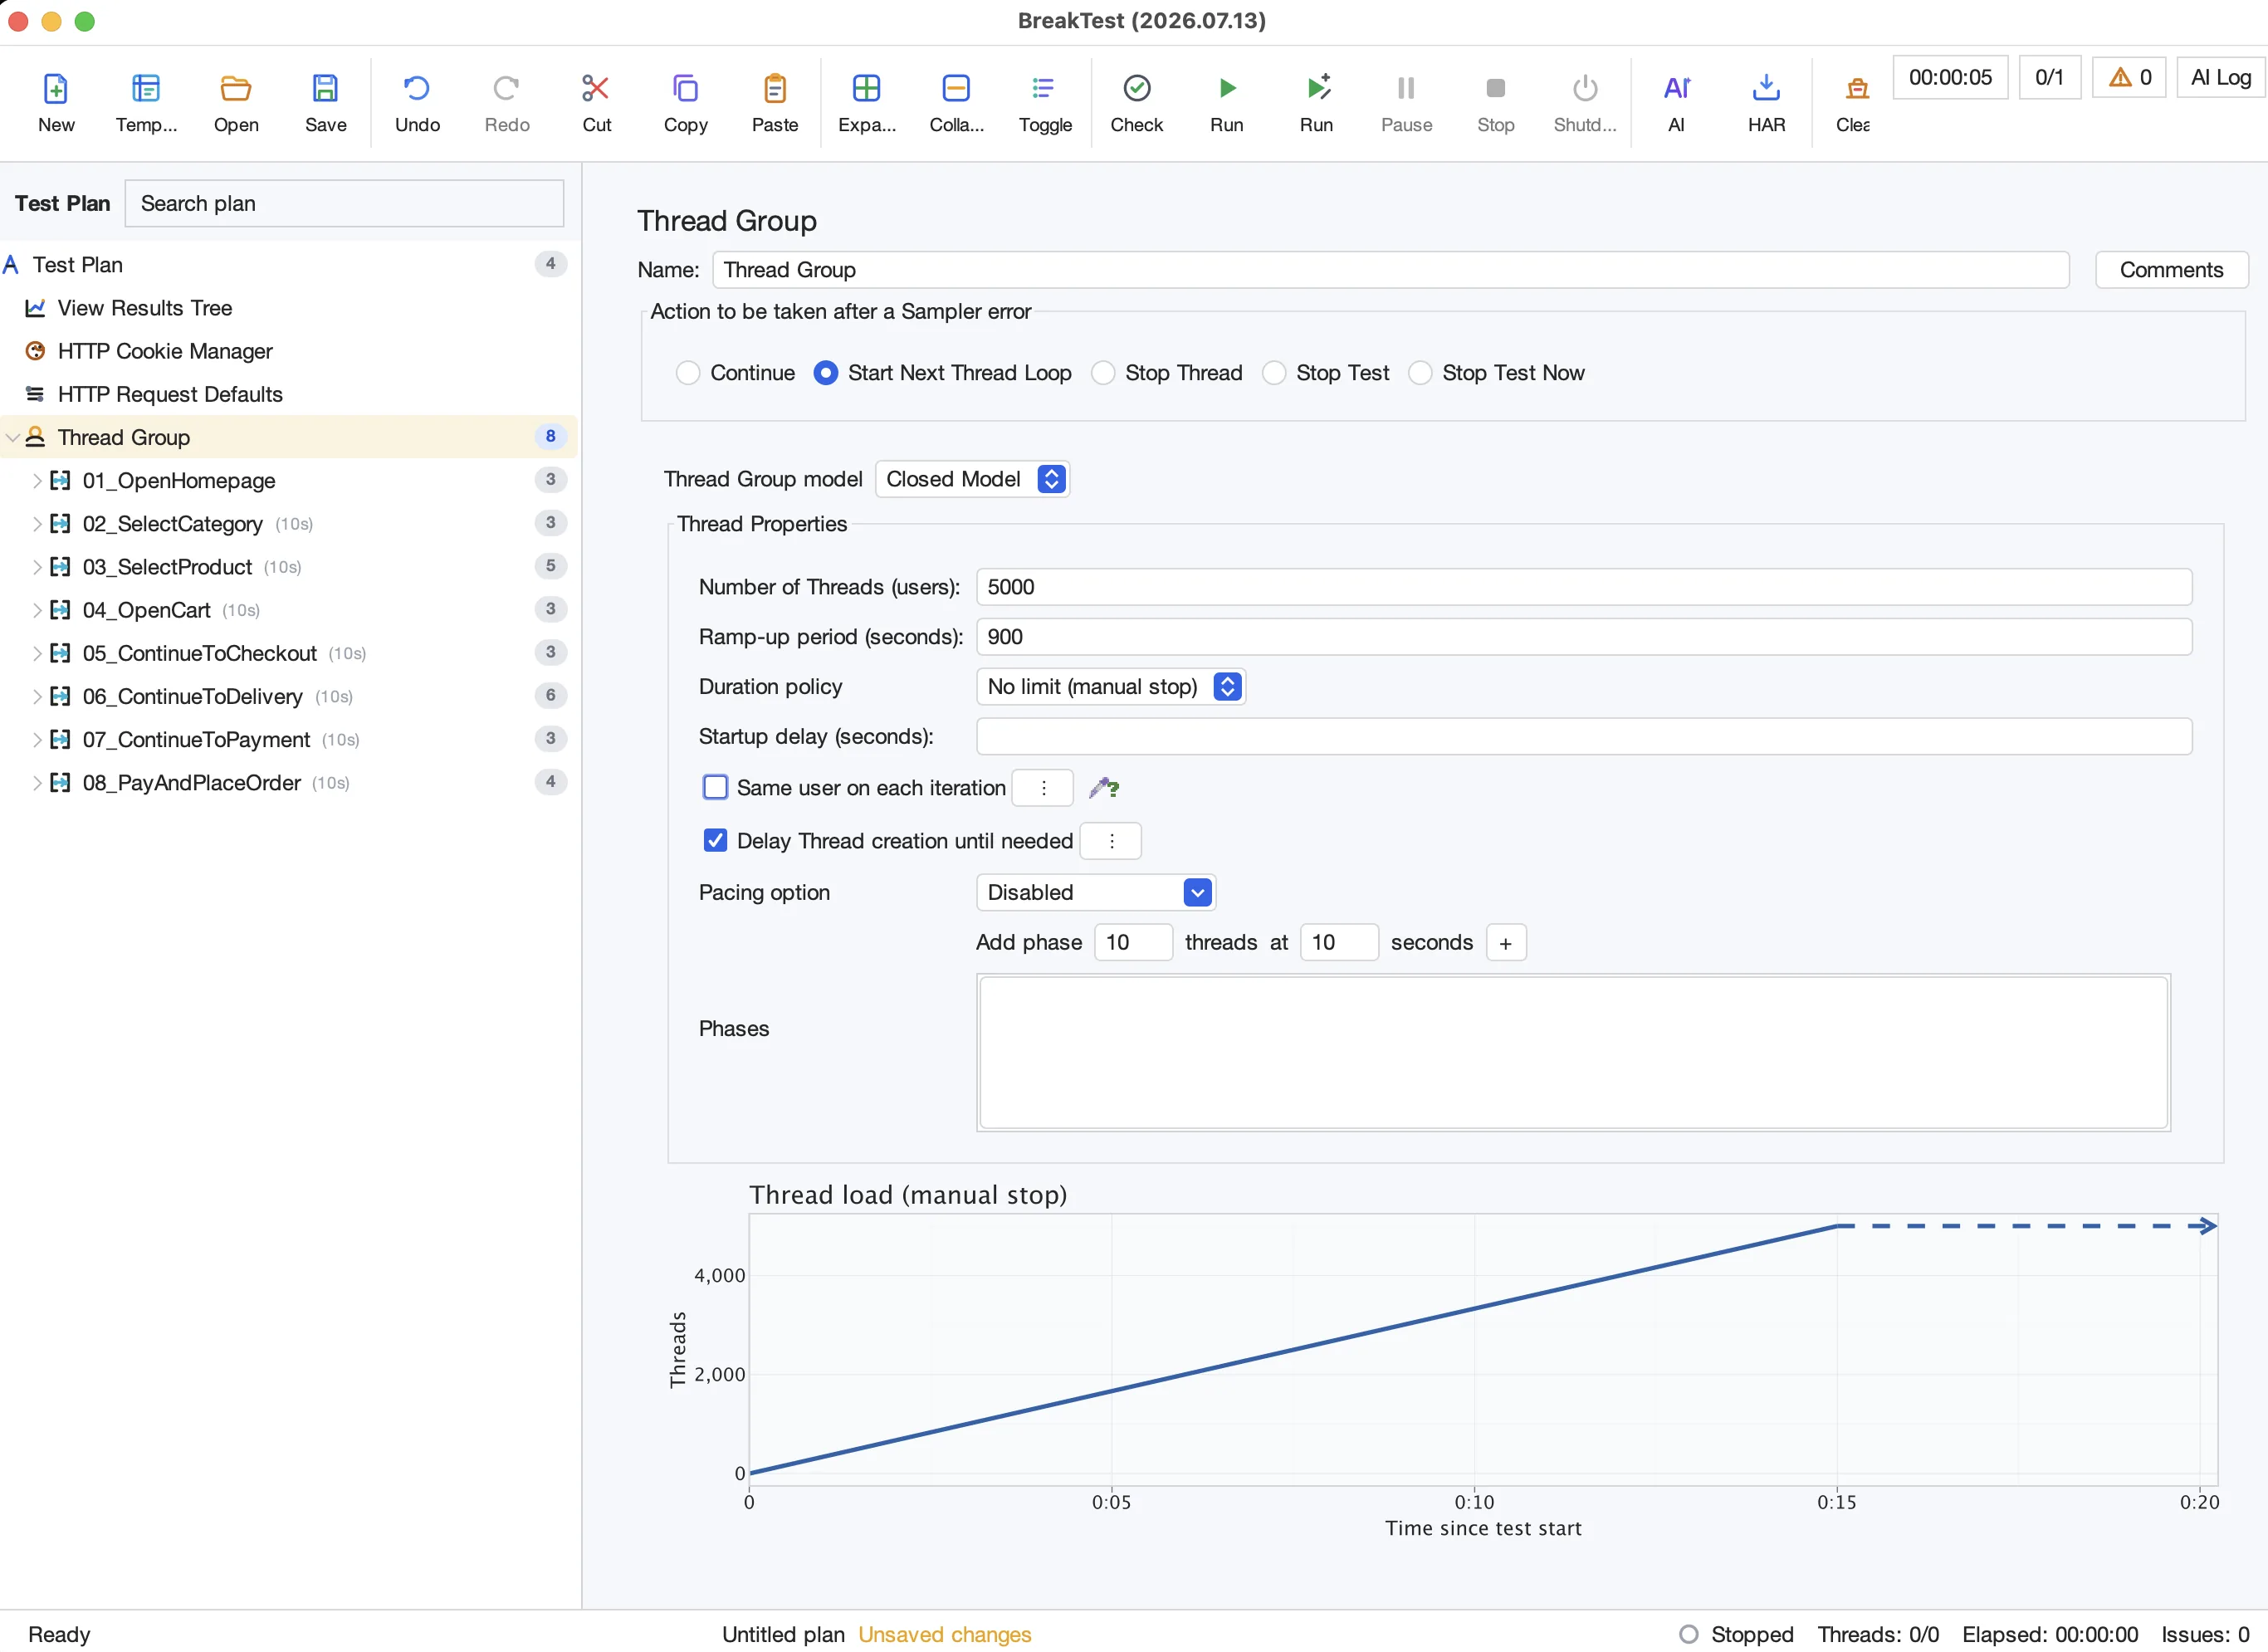
BreakTest's modern desktop interface in the light theme. Select the image to open it full size. 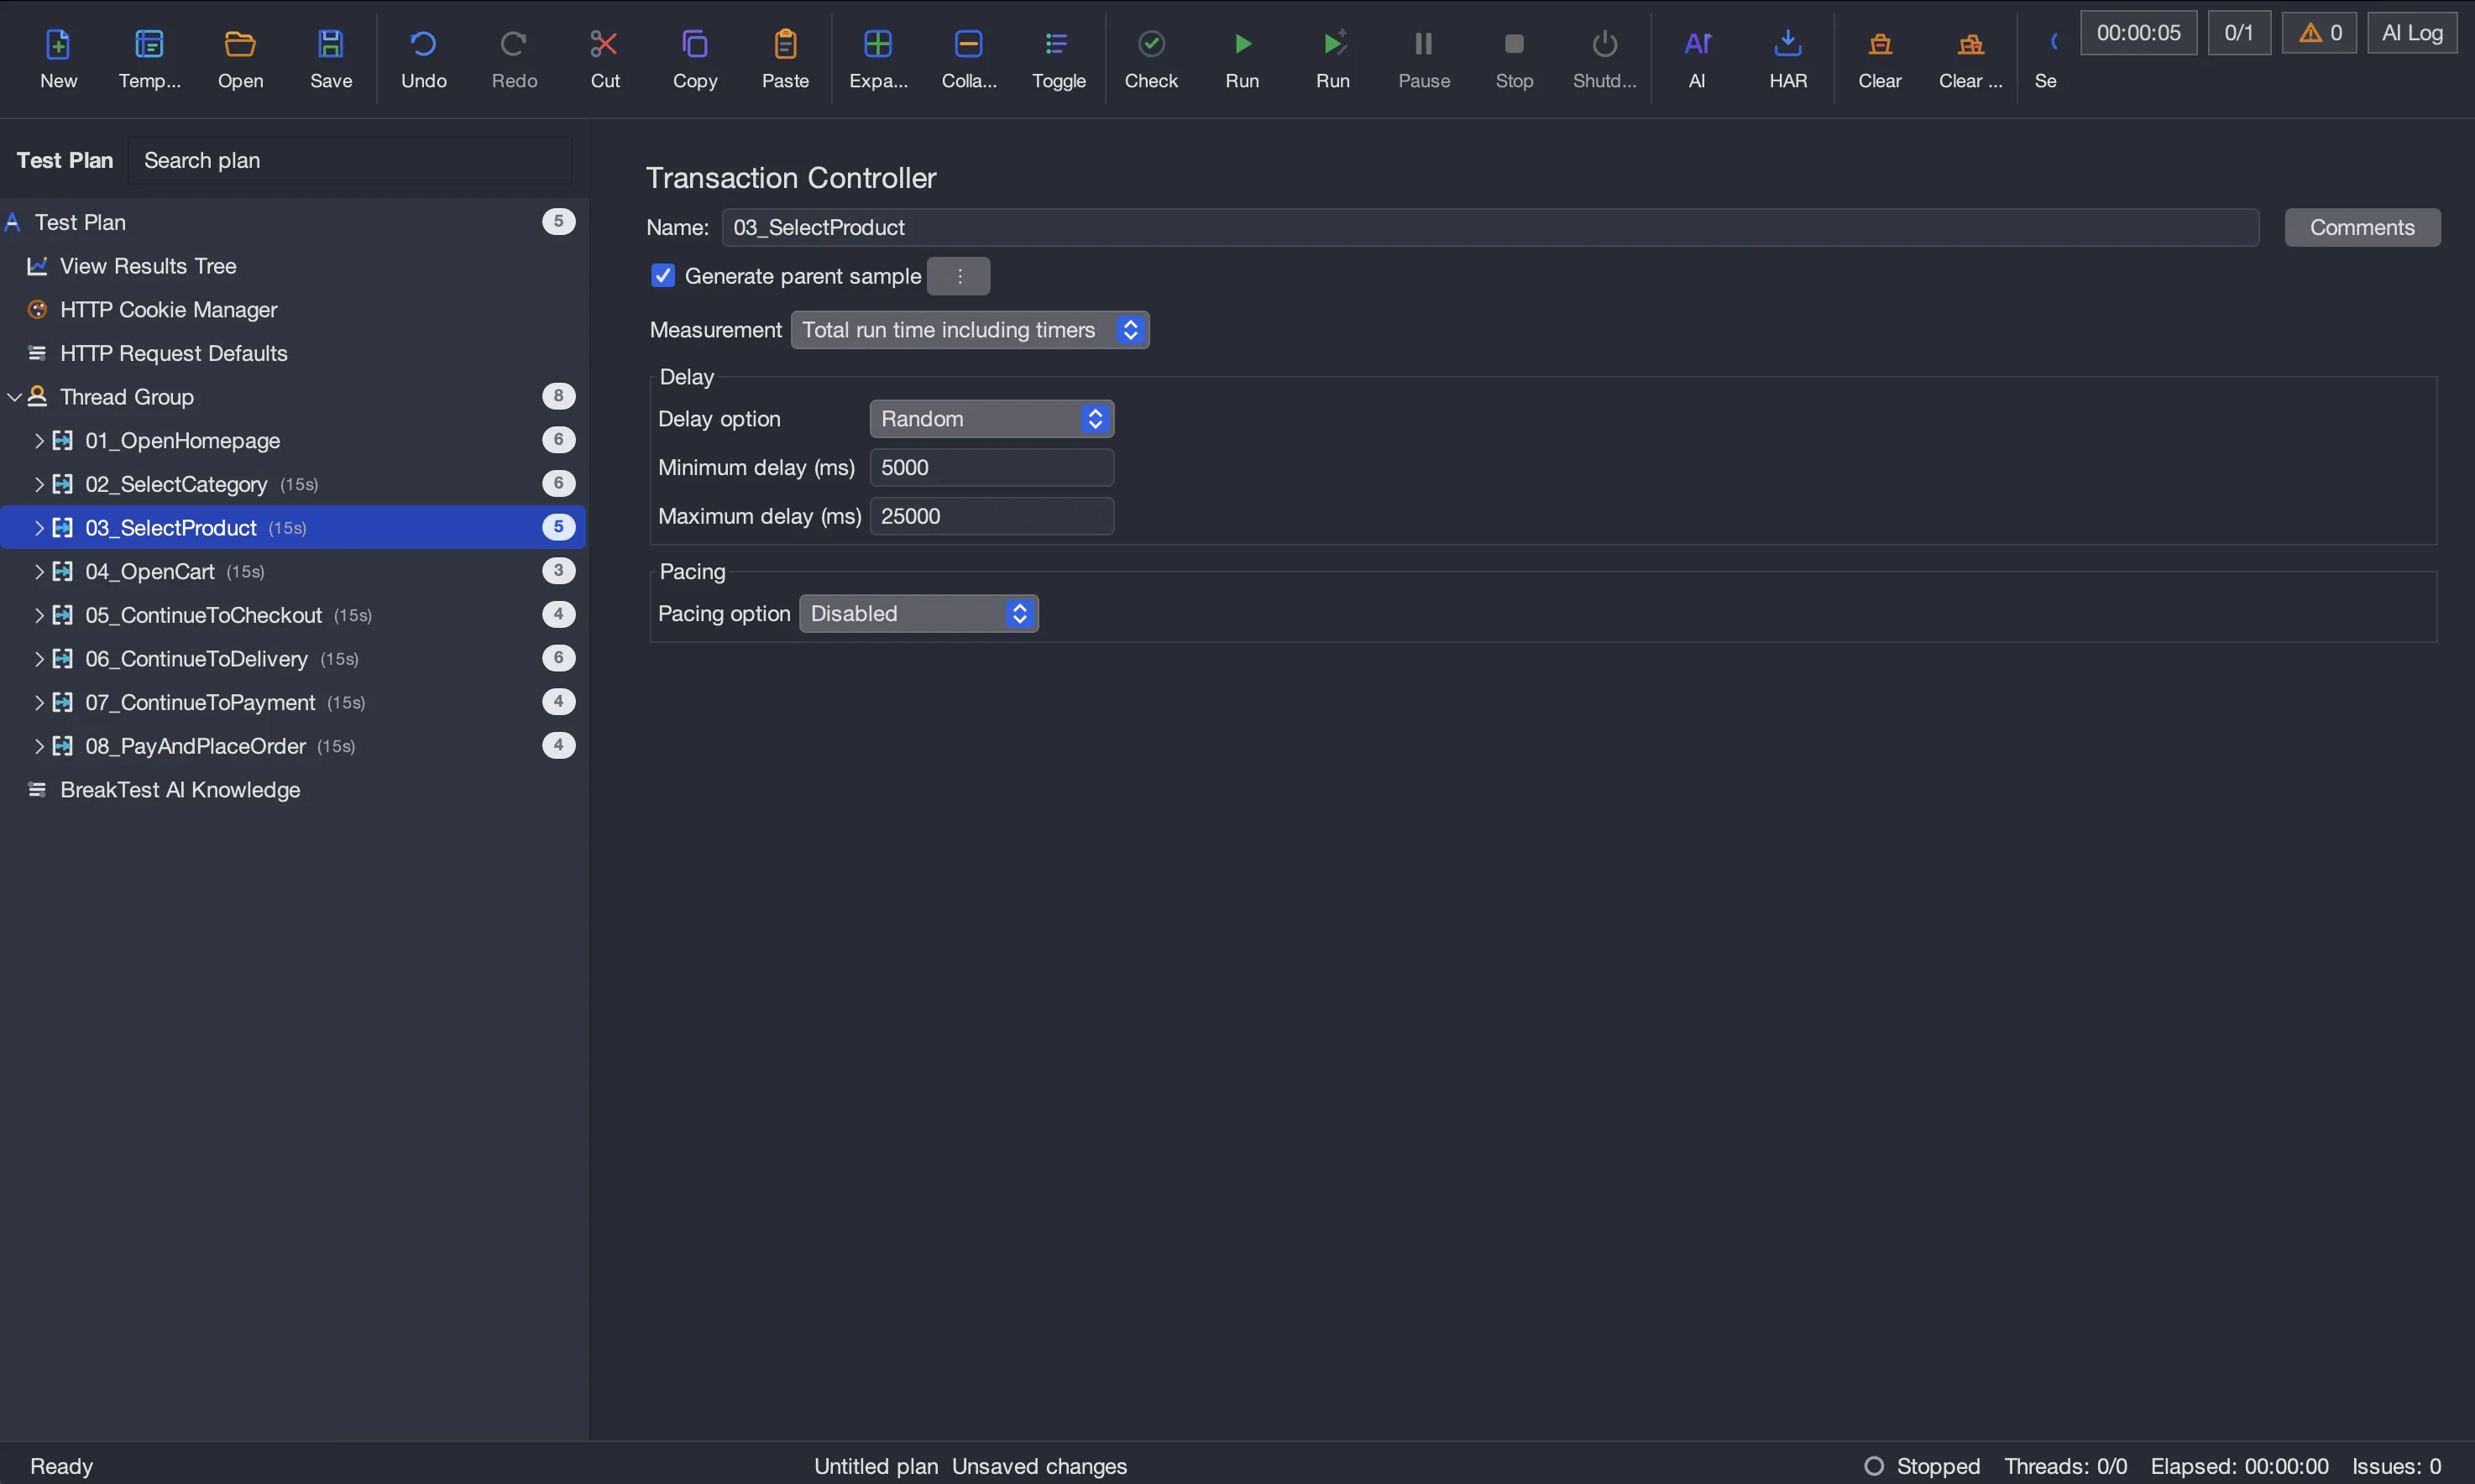
The same compact desktop workflow in dark mode. Select the image to open it full size. -
Settings, without hunting through .properties files
A searchable settings dialog over the full properties catalog.
The Settings page makes the full JMeter and BreakTest properties catalog discoverable in the GUI. Browse by category or search across settings, read a plain-language description and current default, then change booleans, numbers, and text values with the appropriate editor.
Changes are written to local
user.propertiesor system override files instead of modifying the bundledjmeter.propertiesdefaults. Your configuration therefore survives BreakTest updates, while modified-setting badges and per-setting reset make overrides easy to manage.JMeter configuration required knowing which of several hundred properties exists and editing
jmeter.propertiesoruser.propertiesby hand, without validation or discoverability.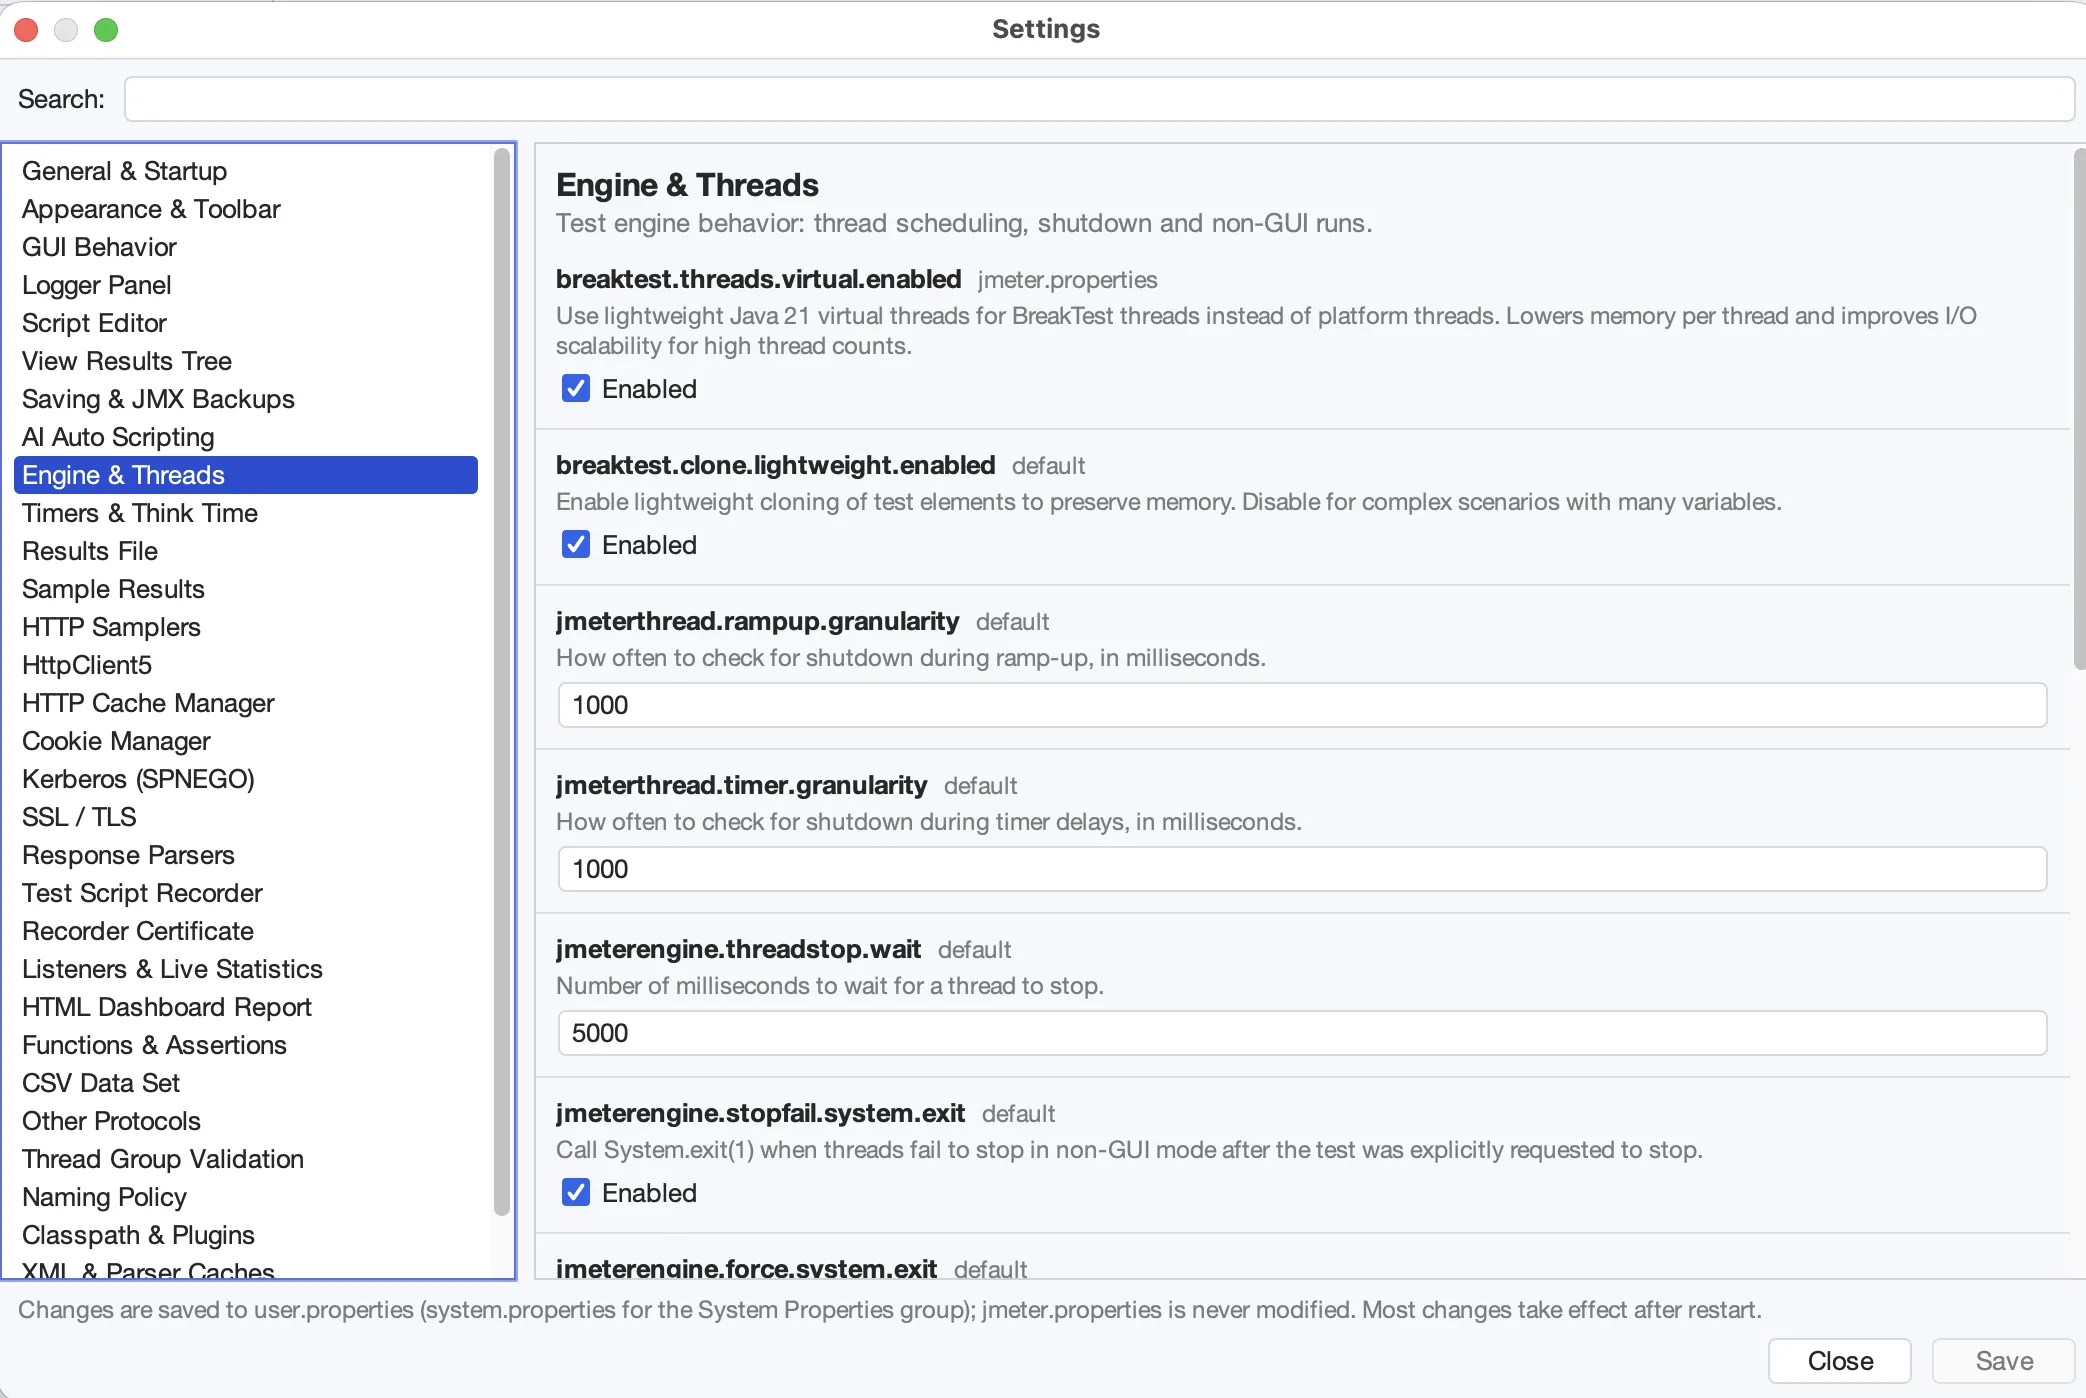
Find and edit the complete properties catalog from one searchable GUI. Overrides are stored separately from bundled defaults, so they remain in place after updates. Select the image to open it full size. -
Easy updates from the GUI
Check, review, and install updates without resetting configuration or plugins.
Use Help → Check for Updates to check for a stable release, review its release notes, and start the update directly from the GUI. BreakTest can also notify you when an update is available; automatic checks are configurable or can be disabled entirely.
The updater verifies the published SHA-512 checksum, installs safely after BreakTest exits, and rolls back if installation fails. Your settings, user properties, third-party
lib/extplugins, and driver JARs are preserved, so updating does not mean rebuilding your local configuration.JMeter had no update flow: staying current meant manually downloading and extracting a new installation, then copying configuration and plugins back into it. BreakTest turns that into a straightforward GUI update.
-
Real undo & redo
Semantic history for add, delete, update, move, search-replace.
The GUI tracks edits as semantic operations, including add, delete, update, move, and search-replace, with standard keyboard shortcuts and menu state kept in sync. AI Repair edits enter the same history and are undoable like manual edits.
JMeter had no undo: an accidental deletion could only be recovered from the last saved file. That risk discouraged restructuring of large plans. With operation-level history, each undo step corresponds exactly to one edit.
-
Large plans open fast
Fast loading by default and responsive editing for large request bodies.
Fast JMX loading is now the default: large plans open without initializing every element editor. Existing explicit preferences remain respected; set
breaktest.gui.load.fast=falsefor components that require editor initialization during loading.Large bodies and very long lines switch to unwrapped plain text without syntax highlighting or folding, keeping the full content editable. Normal editor behavior returns when smaller content is loaded.
-
Missing plugins don't block the file
Unknown elements load as disabled placeholders with a notification.
Plans containing elements from unavailable plugins load anyway: unknown elements become disabled placeholders that preserve their configuration, and a notification lists what is missing. The plan can be inspected, partially migrated, or reloaded after installing the plugin.
JMeter refused to open a JMX containing any element it could not instantiate, making the entire file inaccessible over a single missing plugin. This is a frequent obstacle when inheriting older suites or moving between environments.
-
Search, audit & remove matching elements
Find assertions and extractors, spot missing coverage, delete matches, and undo bulk changes.
Scope searches to a thread group and target specific search areas, including header or parameter names and values. Preview removal of individual rows without deleting their requests, optionally remove emptied controllers, and undo the operation. Recorded-response search opens the exact occurrence.
Opening search follows the thread group containing the current selection. Variable and function autocomplete is also available in Search and Replace fields.
Search the test plan and delete exactly the matched elements after reviewing a confirmation. This turns bulk maintenance, such as removing every obsolete listener, timer, or pre-processor, into one search and one controlled change instead of a manual pass through the tree.
BreakTest can also flag samplers and transactions that contain assertions or extractors. The markers make those elements easy to locate and expose the places where validation or extraction is still missing.
Bulk changes participate in the normal undo history. If a mass removal did not produce the intended result, Undo restores it instead of forcing you to reload the plan or rebuild deleted elements. In JMeter, search results could not be acted upon and accidental mass edits had no undo path.
Removed & compatibility
-
Legacy AI Knowledge migration
Legacy Knowledge notes must be copied before saving migrated plans.
AI repair no longer reads or writes legacy AI Knowledge elements. Existing plans display their notes as read-only text, but saving omits those elements and notes while preserving their children. Copy any notes you need before saving.
-
Legacy scripting engines removed
BeanShell, BSF/JEXL2, Rhino JS, LogKit are gone; JSR223 + Groovy stays.
BreakTest standardizes scripting on JSR223 with Groovy and removes BeanShell, BSF/JEXL2, Rhino JavaScript, and LogKit. BeanShell is unmaintained and slow; BSF has been deprecated for over a decade; Rhino predates modern JavaScript. None of these engines compile and cache scripts the way JSR223 with Groovy does, and they were a recurring cause of load-test performance problems attributable to the scripting engine itself rather than the system under test. Each also carried its own dependencies and security surface.
Porting is usually limited: most BeanShell snippets are a few lines, and AI Repair performs the conversion from a single instruction ("port all BeanShell to Groovy").
-
RMI Remote Server removed
Distributed execution moved to the platform instead of 90s-era RMI.
The RMI-based Remote Server mode is removed. Its design had structural problems: brittle connection setup, poor fit with firewalls and TLS, result aggregation that discarded detail, and a coordinating GUI that became the bottleneck of the test it was running. Removing it also removed a significant security surface from the desktop tool.
Distributed execution is handled by BreakTest Enterprise instead, with orchestrated load generators, streaming results, and complete raw data. The free tool concentrates on being the best single-machine scripting and execution environment.
-
BreakTest naming throughout
BREAKTEST_*environment variables,breaktest.jar, its own Maven group.The product uses BreakTest names across the visible runtime:
BREAKTEST_HOME,BREAKTEST_OPTS, andBREAKTEST_LANGUAGEare the preferred environment variables,breaktest.*properties are used for configuration, the primary launcher isbreaktest.jar, and BreakTest-owned artifacts are published under thenl.breakingit.breaktestMaven group. Distribution archives extract to stable top-level directories.Compatibility names are retained where existing plans, scripts, and plugins depend on them, including the legacy launcher name for the time being. Existing automation keeps working while new setups can use the BreakTest names consistently.
-
BreakTest Community Source License
Free for testing systems operated by your own organization.
BreakTest-specific code and materials are licensed under the BreakTest Community Source License 1.0. You can use BreakTest at no cost to test systems operated by your own organization, including internal development, quality assurance, and performance engineering work.
Using BreakTest to provide a testing service to third parties, operate a hosted or commercial platform, redistribute the product, or for another excluded commercial use requires written permission from Breaking IT. Contact [email protected] to discuss licensing for those uses.
Portions derived from Apache JMeter and included third-party components retain their respective licenses, notices, and attribution. Those licenses are included with the source and distribution.
This model keeps BreakTest free for the engineers and organizations using it on their own systems, while businesses building commercial services around BreakTest contribute to its continued development.
-
What this means for old plans
Open legacy JMX plans, migrate in memory, and keep a compatible backup before saving.
Existing JMeter plans migrate in memory when opened in the GUI. Workload settings become scenario rows, test-level configuration moves into Shared Profile, and listeners move into their own section. Opening a plan does not overwrite its source.
Saving writes BreakTest’s native structure and offers a JMeter-compatible backup before replacing an existing plain JMX. Keep that backup if the plan must also run in JMeter or older BreakTest versions. Native WebSocket/SSE elements and streaming recordings require newer BreakTest versions.
Unsectioned plans retain their legacy non-GUI execution path when no scenario or profile override is requested. Plugins depending on removed internals may require migration. The old Transaction Controller parent-sample option is discarded; custom listeners or result consumers relying on that structure should be updated.
What this changes day to day
- Record with the Browser Recorder, import the HAR, apply predefined correlations, and use AI Repair for the application-specific remainder.
- Broken extractors fail the sampler immediately, with no more silent bad data.
- Reuse one journey across workload scenarios and environment profiles.
- Record and test HTTP, WebSocket, and SSE in the same plan.
- Shape load as arrivals per second when that's what your SLO talks about.
- Pause a test, inspect it, and resume without restarting a two-hour run.
- Validate plans in seconds because pacing sleeps are skipped.
- Undo the restructuring you regret.
Upgrading from JMeter
- Open your existing JMX and review its migrated scenarios and profiles. Keep the offered JMeter-compatible backup before saving.
- Install Java 21+ first; older Java versions are not supported.
- If a plan uses BeanShell, port those few snippets to Groovy (AI Repair will do it from an instruction).
- If you used Remote Server, that workflow now lives in Enterprise.