
BreakTest Enterprise

Break It Before
Your Users Do

Run BreakTest, JMeter, k6, and k6 browser scripts across generators you control. Follow failures while the test is running, then analyze the complete measurement history when it ends.

  • Millions of VUs and requests per second
  • Metrics retained for every measurement
  • Managed or fully on-premises

Your infrastructure, your data. Control plane, generators, credentials, and results can all stay inside your own environment.

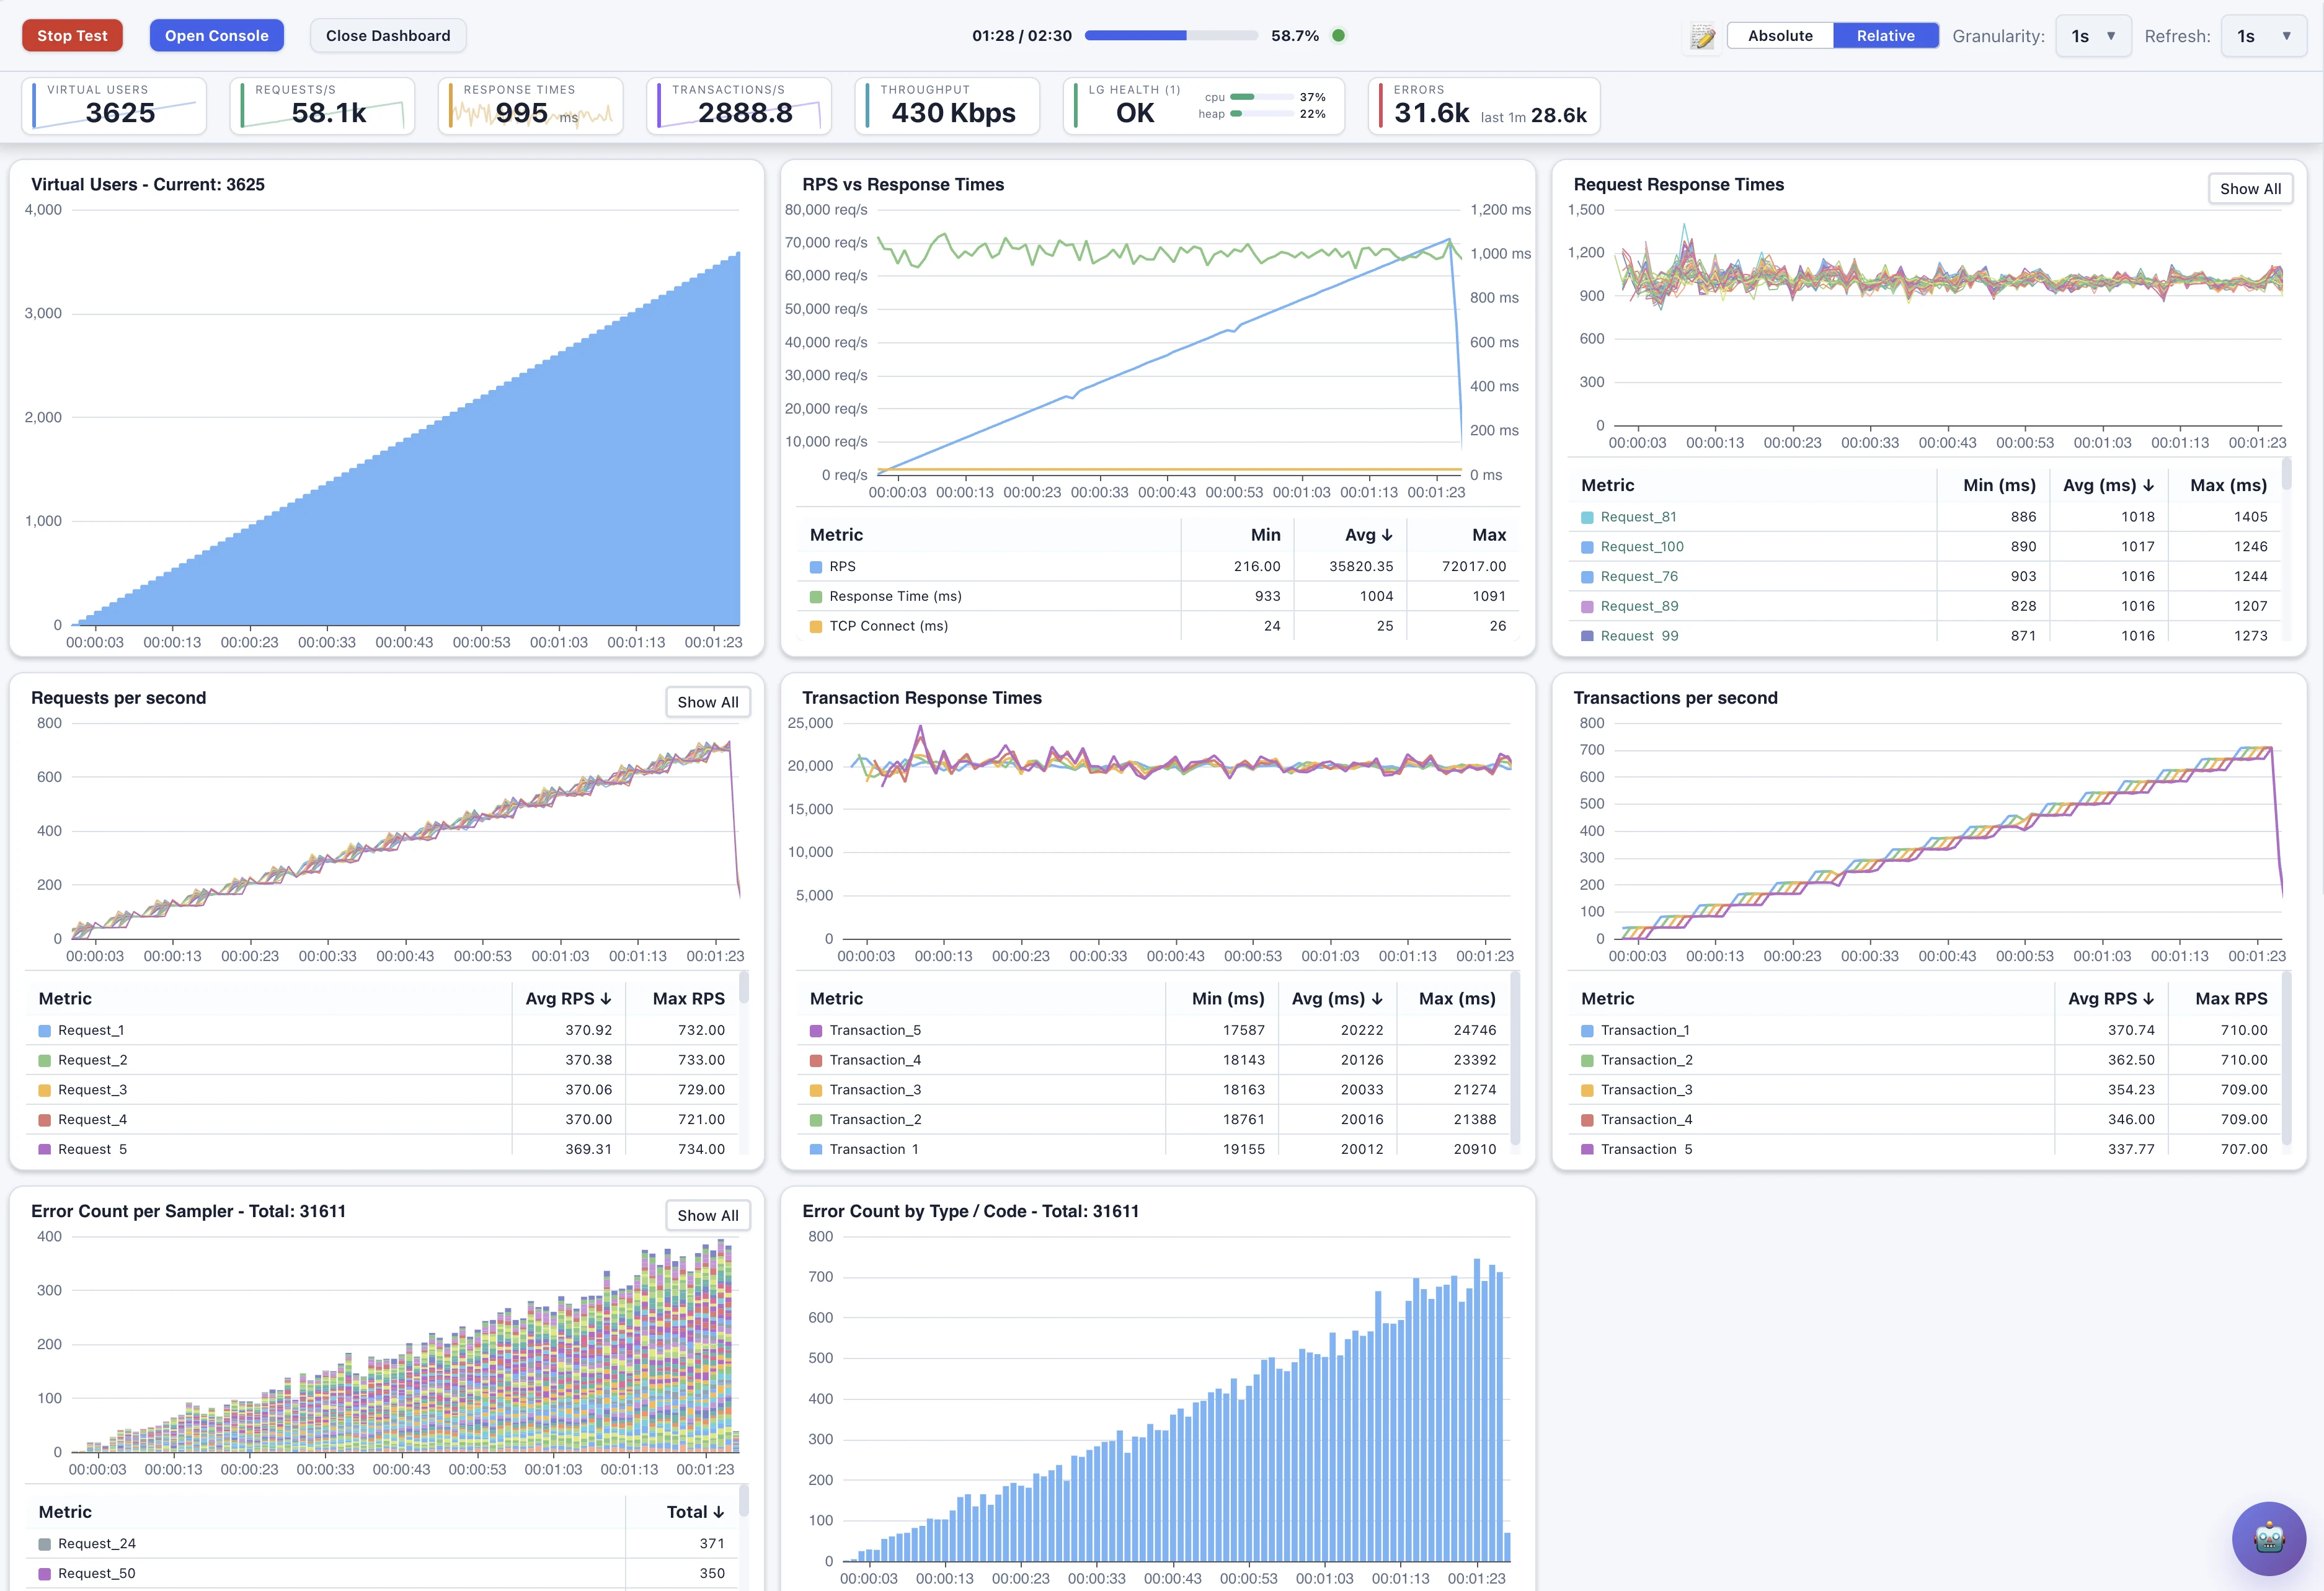
BreakTest live test dashboard showing thousands of virtual users, throughput, response times, and errors in real time
A real test in progress. Live users, throughput, response times, transactions, and failures in one view.
MillionsVUs & requests per second
100%Measurement metrics retained
<1sTest start
3 enginesBreakTest · JMeter · k6
On-premOr managed, your choice

Real product walkthrough

Watch your performance test unfold in real time.

Watch a BreakTest run start in under one second, then follow the virtual users, throughput, response times, transactions, and errors as the load develops.

2-minute live demo. Launch, ramp-up, live charts, request-level metrics, and the errors overview, with no staged interface.

BreakTest and BreakTest Enterprise

Use the full platform free up to 250 virtual users.

BreakTest is the fastest place to create, debug, and benchmark test scripts. BreakTest Enterprise adds the on-premises web platform around them: live execution, high-quality graphs, raw-result analysis, run comparison, and CI/CD automation. A free license includes up to 250 virtual users, unlimited tests, and unlimited test hours during its term.

1 · Script

Create with BreakTest

Record in the browser, import a HAR, and build or debug the script in BreakTest. You can also bring the JMeter and k6 suites you already maintain.

2 · Enterprise free

Run up to 250 VUs

Run from the web interface on your own infrastructure, with unlimited tests and test hours, live graphs, complete analysis, run comparison, and CI/CD integration.

3 · Scale on request

Fixed pricing above 250 VUs

Choose the capacity and duration you need. There is no VU-hour billing and no test-count limit. Optimised load generation requires fewer machines, while every generator stays in your cloud or datacenter for privacy and predictable costs.

During the test

See the failure while the system is still under load.

Most tools make you wait for a report. Enterprise streams results as they happen: response times, throughput, and errors update continuously, and you can open the exact failing request, including its headers, body, timings, and rendered HTML, the moment it appears.

  • Streaming charts for response times, throughput, users, bandwidth, and errors
  • Drill from a spike in a graph straight into the requests behind it
  • Metrics for every measurement; full request and response bodies for every error
  • Rendered HTML and k6 browser screenshots next to the protocol detail
  • Filter by transaction, status, generator, location, or time window
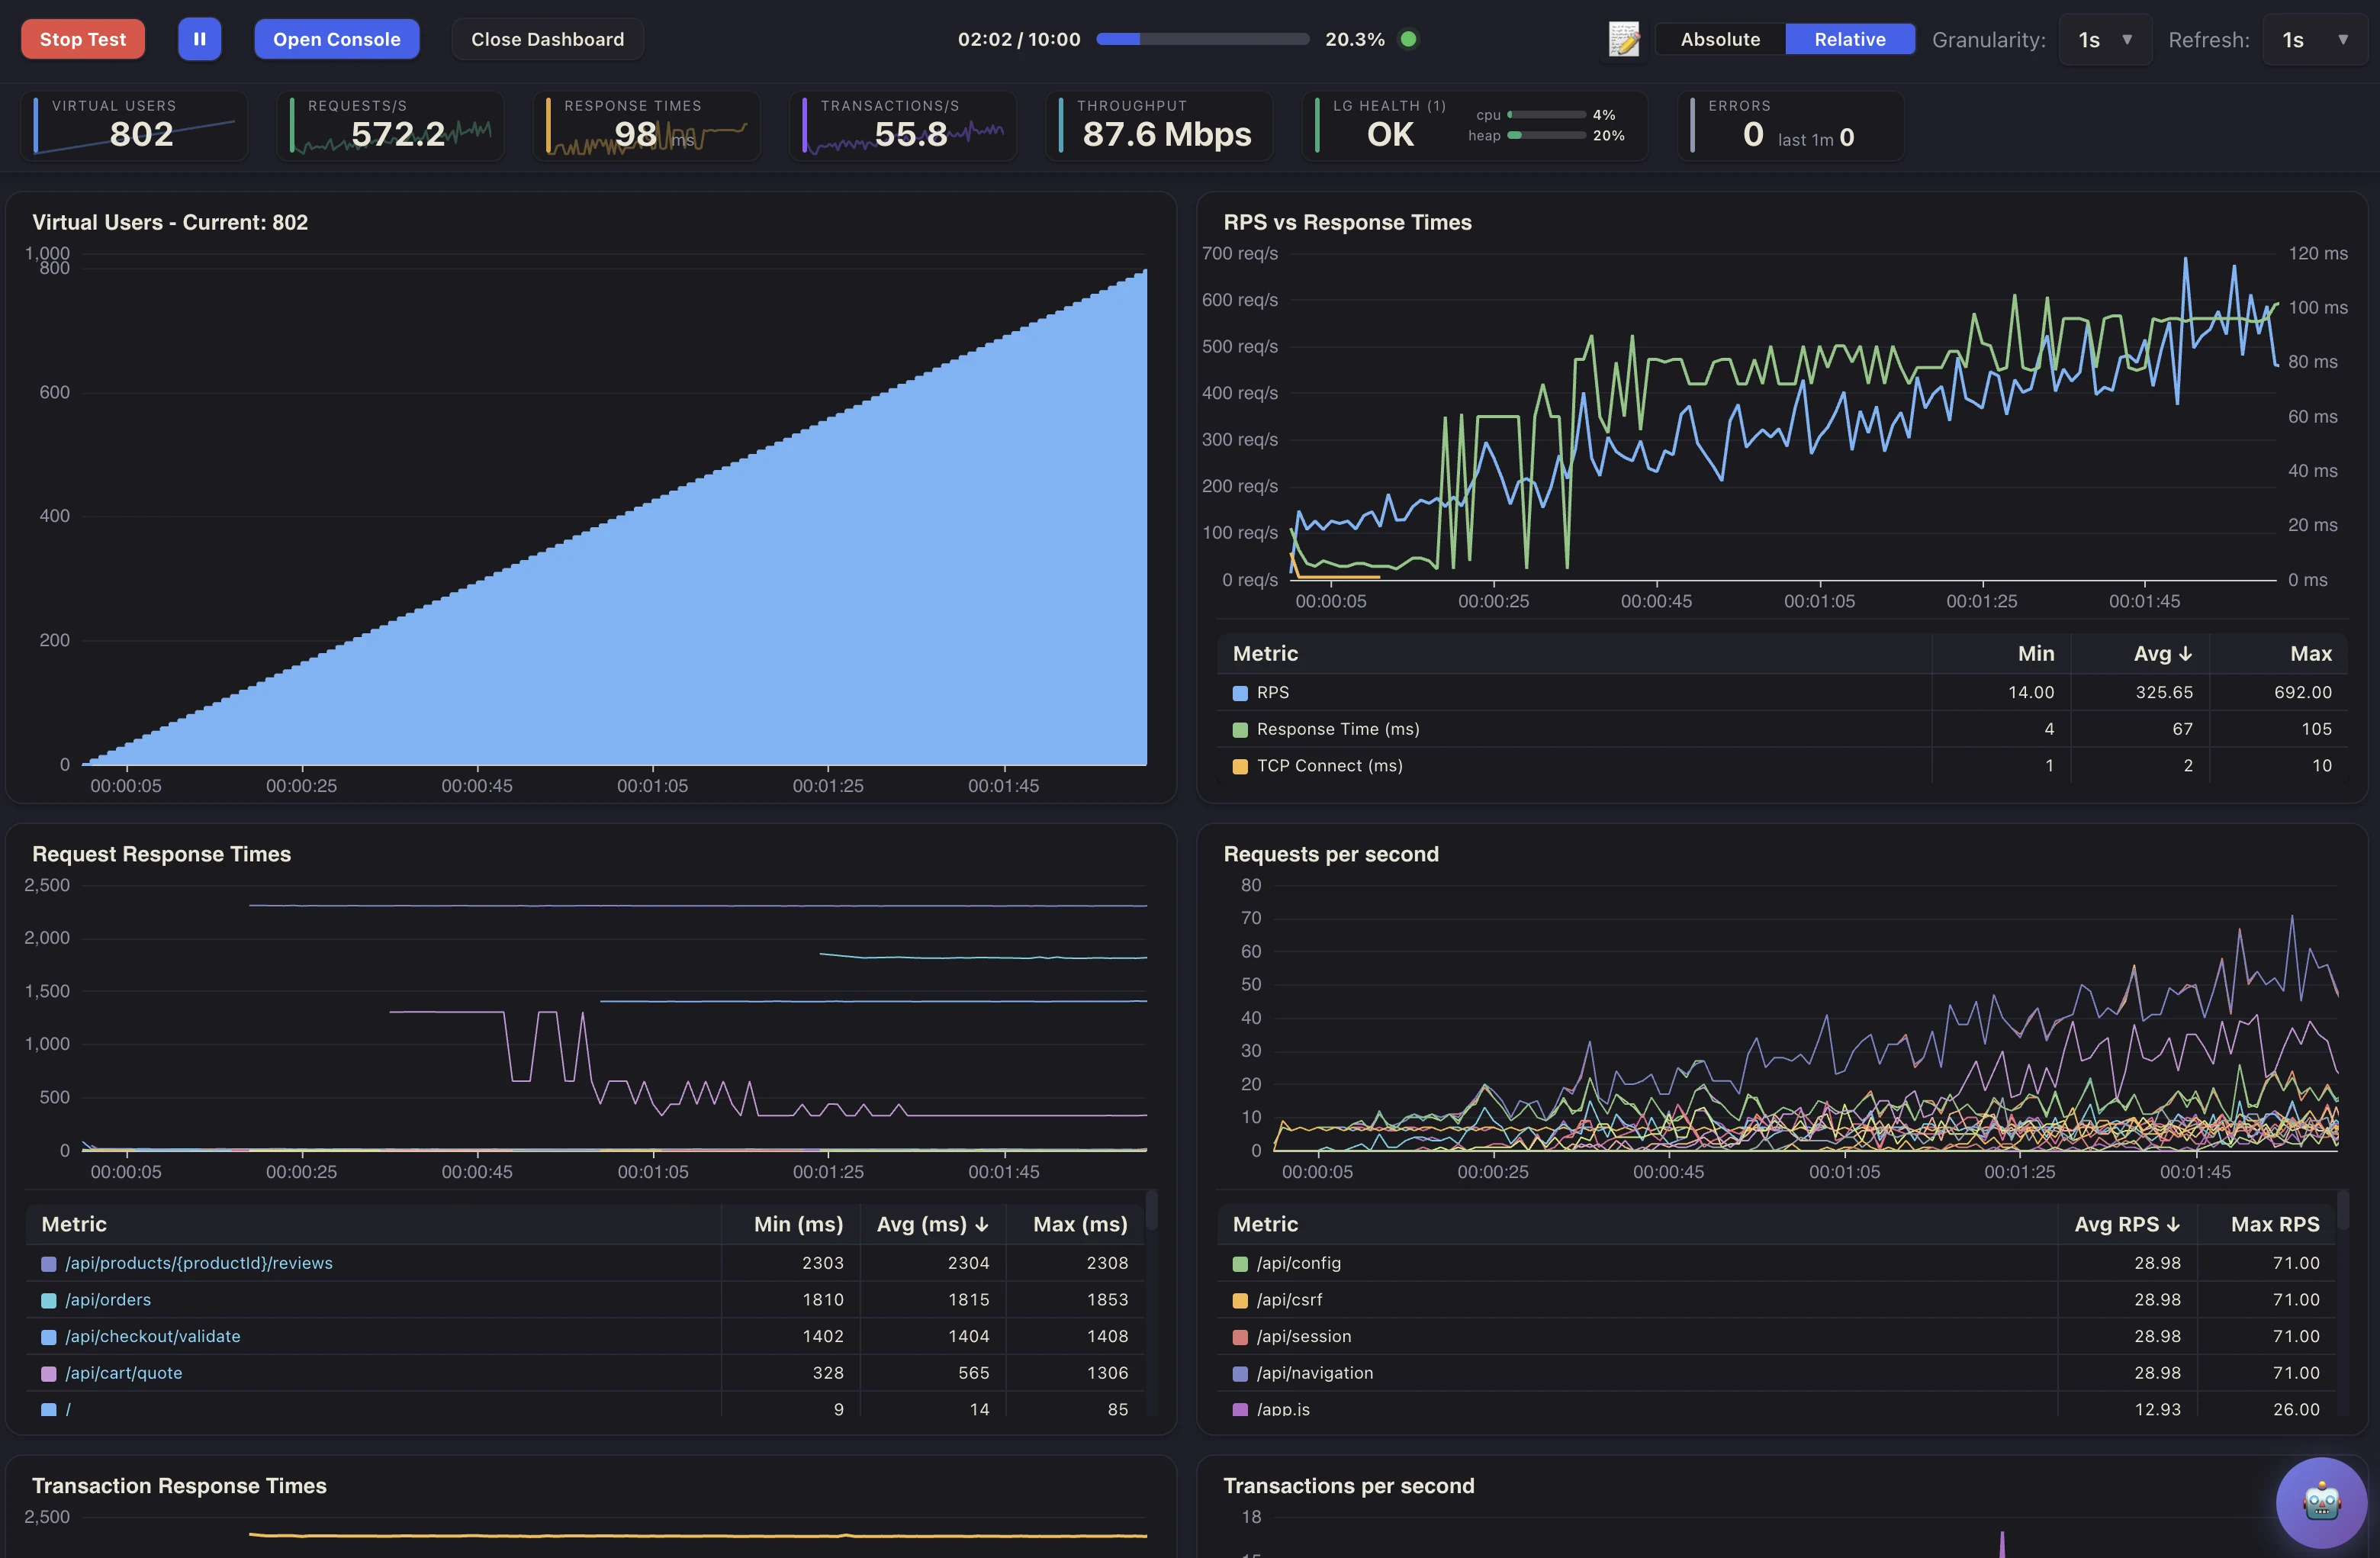
Dark BreakTest live dashboard with a virtual-user ramp and continuously updating performance charts
Follow the run live. See the load shape and system response change together.
BreakTest error detail view showing a failed payment request, response timing, status, generator, and assertion information
Open the failing sample. Request and response evidence stays attached to the error.

After the test

Analysis that starts from every measurement.

Aggregation can smooth away the sub-second stalls, bursts, and timing shifts that reveal what is happening under the hood. BreakTest retains the metrics from every measurement, preserving those patterns for deep-dive analysis, exact run comparisons, and percentiles calculated from the original data. Errors also retain their full request and response bodies for diagnosis.

Real percentiles Computed from original measurements, not pre-aggregated buckets.
Exact comparisons Two complete result sets, transaction by transaction.
Outliers survive The slowest requests are still there when you have to explain them.
New questions, old runs Ask something different months later without rerunning the test.
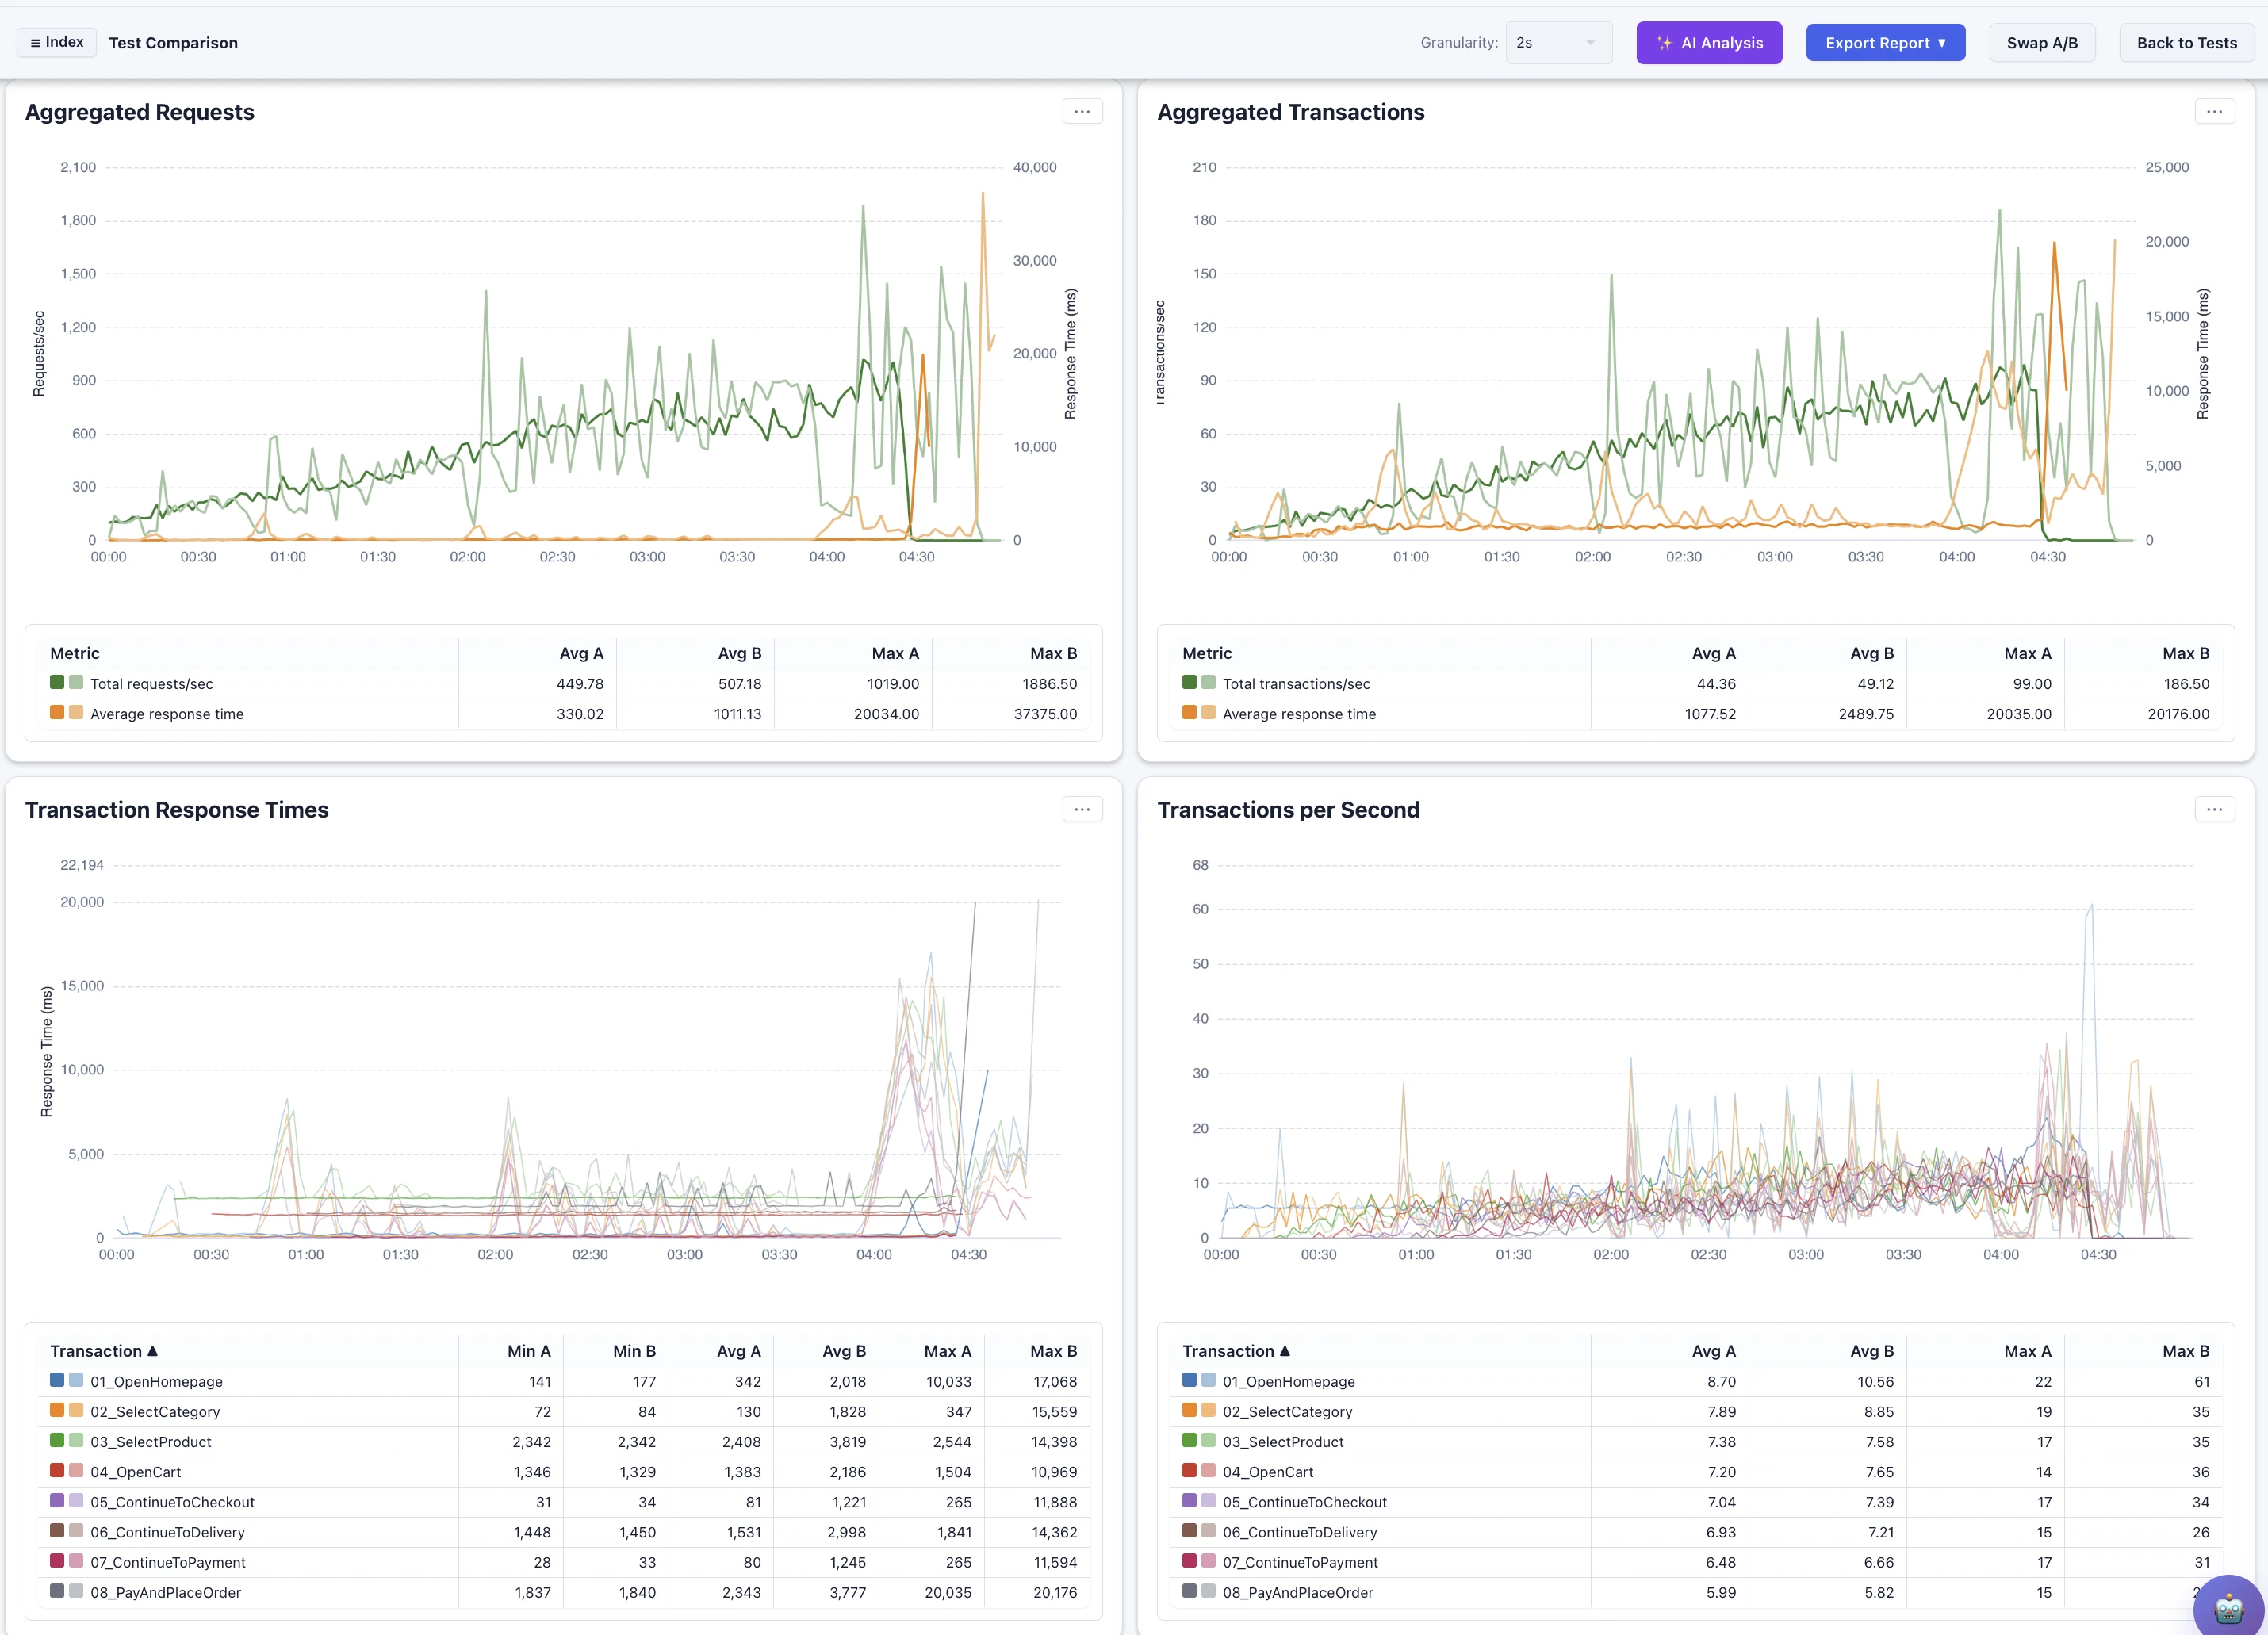
BreakTest comparison of two test runs with requests, transactions, response times, and throughput shown side by side
Compare complete runs. Find where throughput, latency, or a transaction changed between releases.

k6 & k6 Browser

Bring your k6 scripts. Keep every detail.

Add the k6 scripts you already use, configure different workload scenarios, and distribute them across load generators you control. BreakTest gives the run the same live feedback, complete evidence, and deep analysis as every other engine in the platform.

Protocol and real-browser tests share one workflow, so teams can combine fast API load with browser journeys without operating separate result systems.

k6

Protocol load at scale

Optimized execution keeps generator resource usage low while retaining the metrics from every measurement. For every error, the complete request and response headers and bodies remain available with timings and generator context.
k6 Browser

More real browsers per generator

BreakTest's browser tuning supports two to three times more concurrent users on the same resources. Depending on the workload, a load generator can run up to 100 concurrent browser users while retaining full metrics and complete request and response evidence for errors.

2–3×More concurrent browser users on the same resources
Up to 100Concurrent browser users per load generator
Every metricRetained at measurement level for analysis
Full evidenceRequest and response bodies retained for errors
  1. 1
    Add your scriptsUpload existing k6 or k6 Browser JavaScript.
  2. 2
    Set the workloadConfigure the scenarios, rates, duration, and variables.
  3. 3
    Choose generatorsDistribute the run across the locations you control.
  4. 4
    Run and analyze liveFollow metrics and errors from the first second.

Design the load

Shape advanced tests before you scale them out.

Configure open or closed thread models, combine independent thread groups, and build custom arrival phases around the traffic your system really receives. Then run the same scenario across generators you control, whether they run in Docker, Kubernetes, the cloud, or your own datacenter.

  • Open and closed workload models with custom ramp and hold phases
  • Multiple thread groups with independent traffic profiles
  • Proven with millions of concurrent users and millions of requests per second
  • Weighted traffic distribution across as many locations as you need
  • A tuned JMeter-compatible engine that carries more load per machine
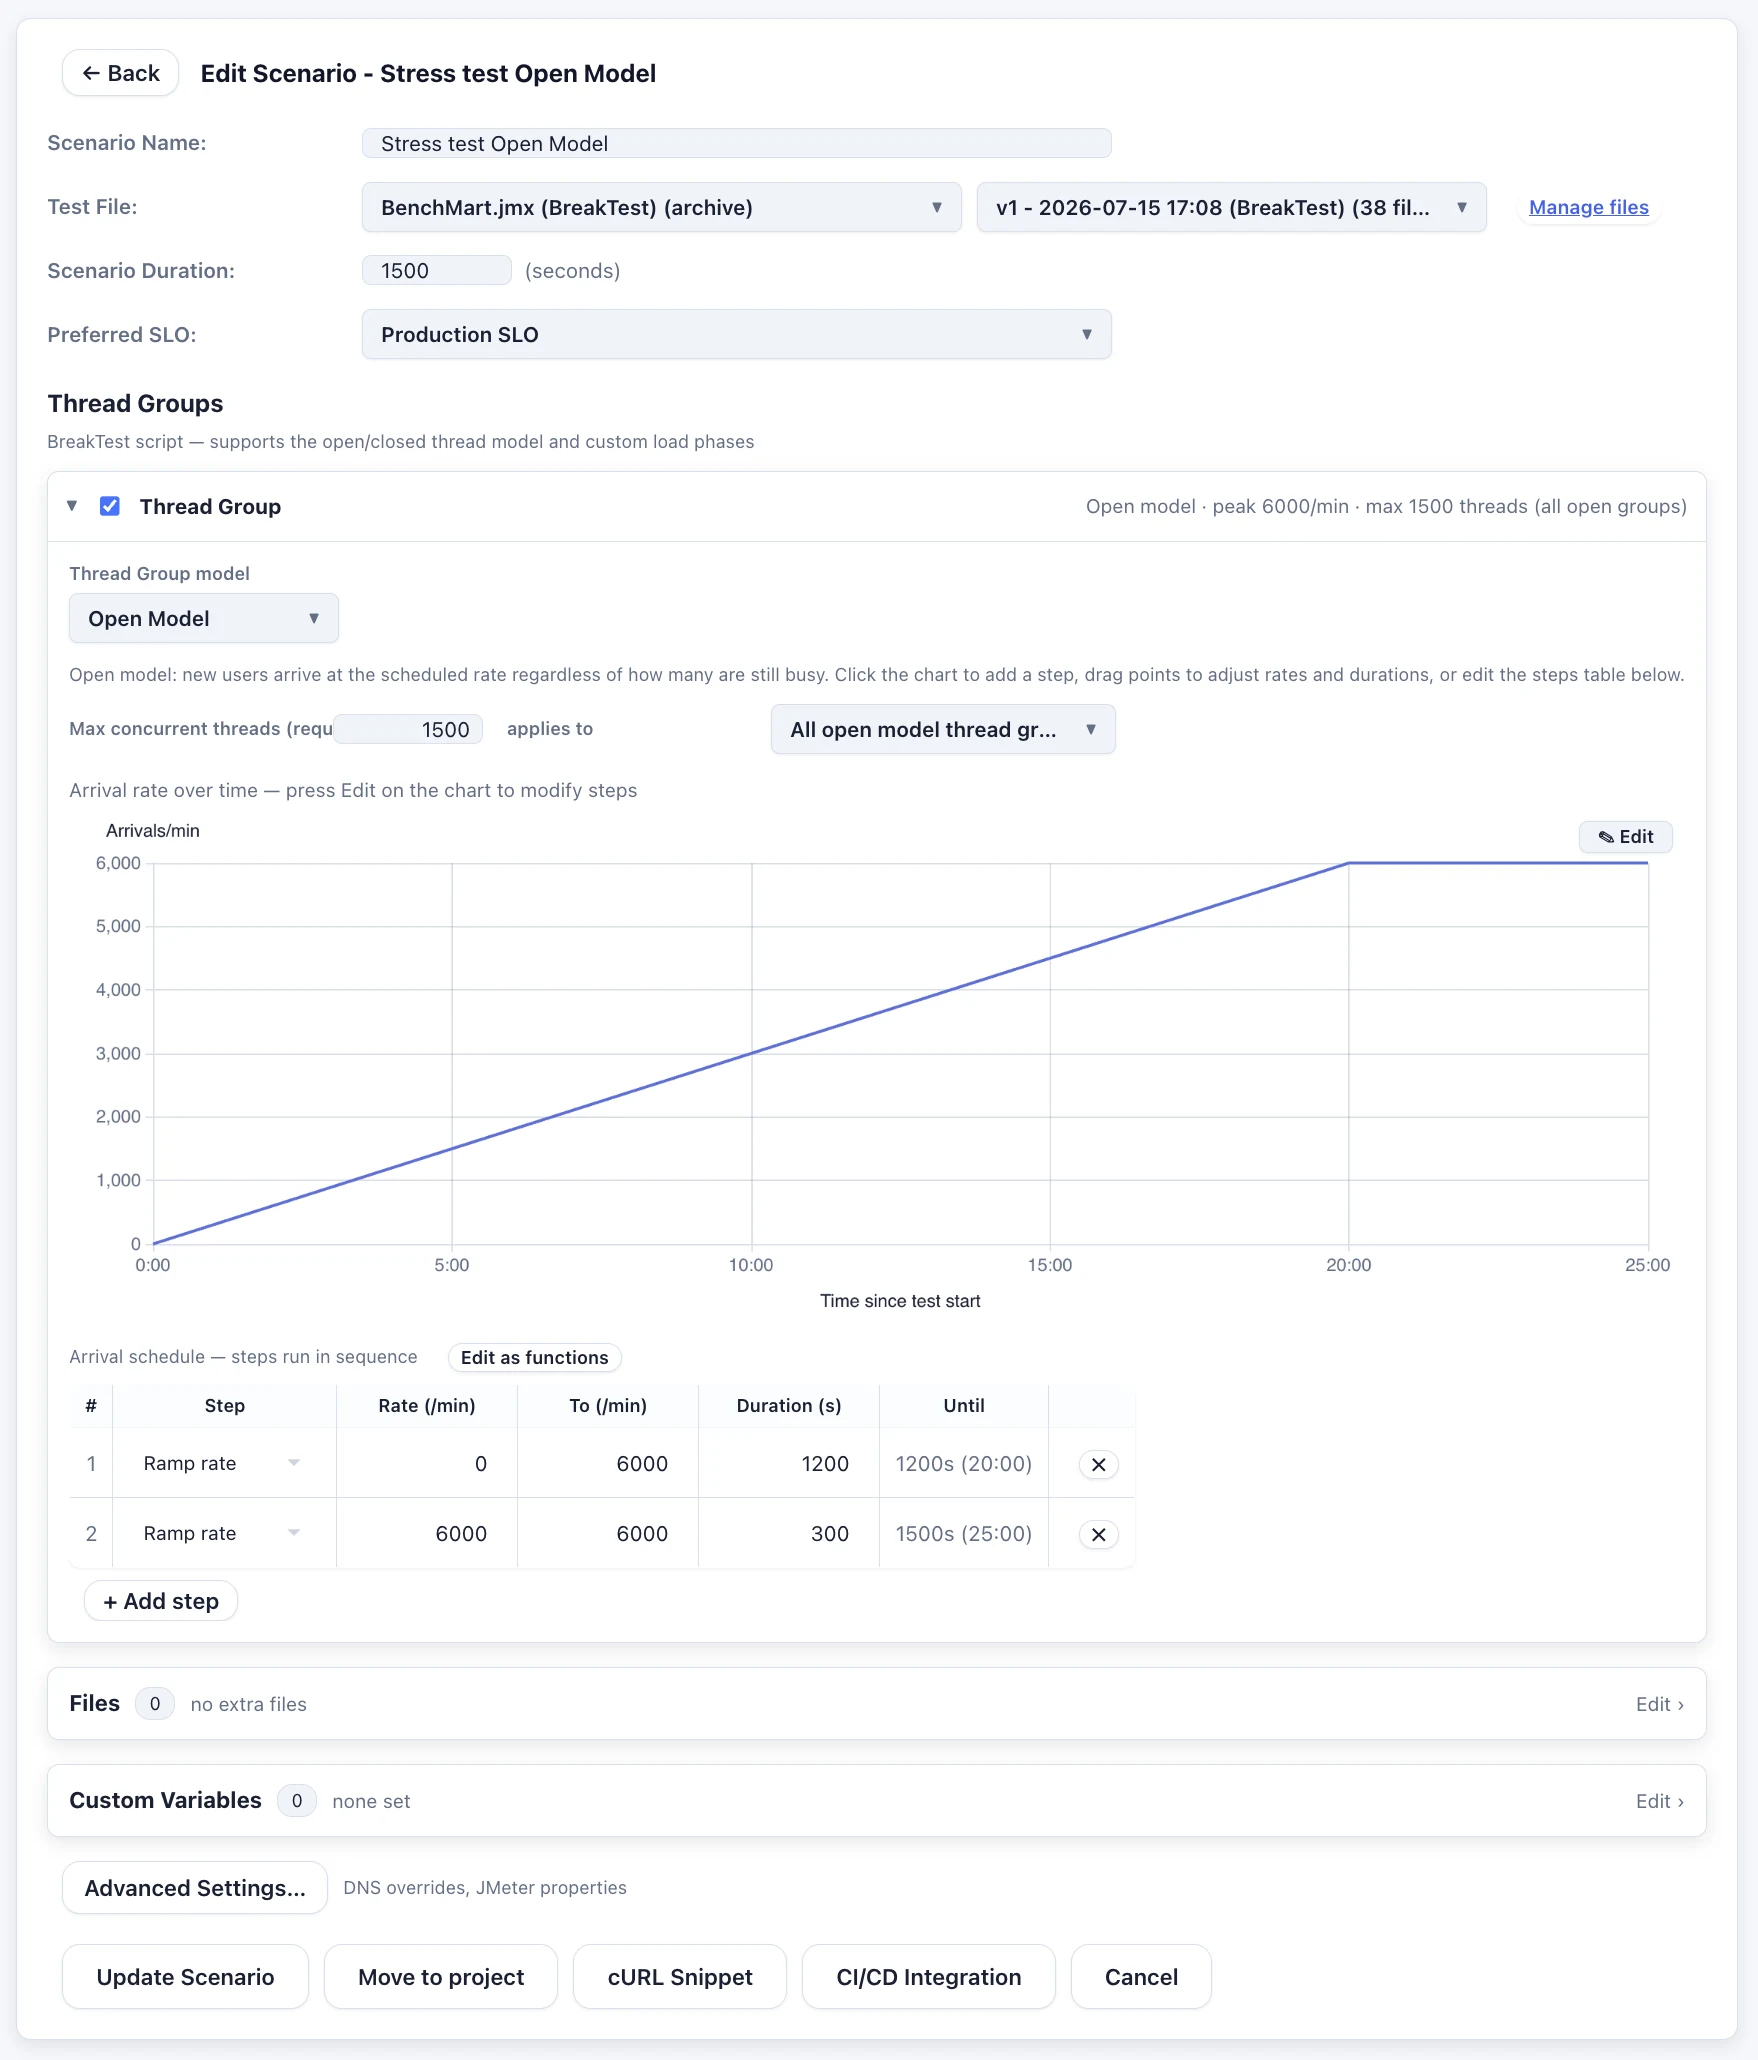
BreakTest scenario editor configuring an open-model thread group with a custom arrival-rate ramp
Model the workload directly. Configure arrivals, concurrency, phases, files, and variables before the run.

In the pipeline

Performance testing that runs itself.

A test that only runs before a major release tells you very little. Everything in Enterprise is available over the API, so the same script can guard every deployment and keep watching production in between.

CI

Gate every release

Trigger a run from GitHub Actions, GitLab CI, Jenkins, or anything that can call an HTTP endpoint. Then let the SLO result decide whether the deployment proceeds.

Pass or fail, returned to the pipeline
SLO

Objectives per transaction

Define what "fast enough" means for the transactions that matter and validate every run against it automatically, backed by the complete result set.

One decision, full evidence behind it
API

API-first by design

Select a test, start a run, follow its status, retrieve results, and read the SLO outcome. The whole lifecycle is available in code, with tokens scoped per project.

No manual step required
AI

An AI performance engineer

Reads the results, identifies likely bottlenecks, explains anomalies, and updates the script. It moves from evidence to action instead of stopping at a chat response.

Every conclusion points back to samples

Deployment

Run it where your systems and your data already live.

Some teams want a platform that is simply there; others cannot send a single test payload outside their network. Enterprise supports both without changing what the product does. The same live feedback, raw-data retention, automation, and analysis apply either way.

Managed

Fastest start

We operate the control plane. You bring scripts and generators and run your first distributed test the same day.

On-premises

Your datacenter

Deploy the full platform in your own cloud account or datacenter. No forced SaaS dependency, no external data path.

Hybrid

Generators anywhere

In both models, the generators run where you put them: next to the target, behind the firewall, or in the region you care about.

Control

Your data, your boundary

Scripts, credentials, test data, traffic, and results stay inside the environment you decide on, under your own access model.

Full capability index

Built by performance engineers, for performance engineers.

Every capability in the platform, grouped and kept short. Select any item for the full story behind it. The reasoning stays with the feature it explains, so the overview remains quick to scan.

Live results & feedback

  • Unmatched real-time visibility Streaming graphs update continuously while the test is running.

    Streaming charts for response times, throughput, active users, bandwidth, and errors update live during the test. You see the system change as load increases instead of waiting for a report after the run.

    Move from a spike in a graph to the requests behind it. The live result is not a summary that hides the evidence; it is the starting point for an investigation while the system is still under load.

  • Every error, while it happens See failures immediately and open the exact sample behind them.

    Errors appear as the test runs, grouped for fast triage without losing the individual samples. Filter them by transaction, status, generator, location, or time window and open the exact failure you care about.

    This shortens the feedback loop dramatically: teams can inspect an error while application logs, infrastructure metrics, and the failing system state all refer to the same moment.

  • Complete error request and response detail For every error: headers, bodies, status, timings, endpoint, and generator.

    Each error retains its complete request and response evidence: headers, bodies, status, timing breakdown, endpoint, test step, generator, and location. You can move directly from the failure to what was actually sent and returned.

    That makes it much easier to separate an application problem from invalid test data, a scripting mistake, an infrastructure failure, or an issue limited to one generator.

  • HTML views & browser screenshots See what the user saw instead of diagnosing from status codes alone.

    Rendered HTML and browser screenshots add the user-visible result to the protocol evidence. Open the returned page, inspect browser output, and see what a k6 browser user saw when a step failed.

    Request, response, HTML, and screenshot views belong to the same error, so there is no separate recording or manual matching exercise.

  • Every measurement retained Metrics remain available at measurement level; outliers are never averaged away.

    The metrics from every measurement are retained without forcing them into aggregate-only buckets. Percentiles can be calculated from the original measurements, outliers stay visible, and errors keep their request and response bodies.

    Filter by label, time, error, generator, or location and trace chart and report results back to the underlying measurements.

Scale & infrastructure

  • Tested at massive scale Millions of concurrent users and requests per second.

    BreakTest Enterprise is proven with millions of concurrent users and millions of requests per second. The platform keeps the live overview responsive while retaining the metrics from every measurement for analysis.

    Scale is not only about generating traffic. It also means ingesting, storing, visualizing, and investigating the full result set without losing the samples that explain what happened.

  • Your own agents, anywhere Local, Docker, Kubernetes, AWS, Azure, or on-premises.

    Run load-generator agents locally, in Docker, Kubernetes, AWS, Azure, or inside your own datacenter. Mix locations with weighted traffic distribution and keep the generators close to the systems and test data they need.

    The agents remain under your control, and the platform shows their health, engine, capacity, traffic weight, and live contribution to the test.

  • Tests start in under a second Bring capacity online immediately and watch every agent live.

    Generators register and become available in seconds, and starting a run takes under a second from the moment you confirm it. Select the required locations and capacity, then monitor health and throughput as the test progresses.

    Fast startup makes temporary, elastic generator fleets practical for pipelines and scheduled tests without keeping unnecessary infrastructure running.

  • Up to 80% lower agent costs with spot instances Run elastic load-generator fleets on low-cost, interruptible cloud capacity.

    BreakTest Enterprise supports running load-generator agents on spot instances. Depending on the cloud provider, region, and available capacity, agent infrastructure can cost up to 80% less than equivalent on-demand instances.

    Spot capacity is a natural fit for temporary test fleets: bring agents online for a run, use them while they generate load, and release the infrastructure when the test is complete.

  • Optimized JMeter engine Lower CPU and memory use means fewer generators at scale.

    BreakTest includes a highly tuned JMeter-compatible engine designed for high load with lower CPU and memory usage. More traffic fits on each generator, reducing the infrastructure required for the same test.

    Existing JMX plans remain part of the workflow, while BreakTest plans can use the improved engine and modern scripting capabilities.

  • BreakTest, JMeter & k6 together Multiple engines feed the same live results and analysis workflow.

    Run BreakTest, existing JMeter plans, k6 scripts, and k6 Browser tests through the same generator and results platform. Add a script, configure its workload scenarios, choose the generators, and follow the complete run live.

    For k6, metrics remain available at measurement level and errors retain their complete request and response bodies. Regardless of engine, the run is observed, stored, compared, validated, and reported through one consistent workflow.

  • k6 Browser optimized for concurrency Two to three times more browser users on the same resources.

    BreakTest tunes k6 Browser for efficient real-browser load. Depending on the workload, one load generator can support up to 100 concurrent browser users while using the infrastructure you control.

    Browser failures retain full request and response evidence alongside the complete metric stream, making real-browser tests useful for live diagnosis as well as scale.

Analysis & quality

  • Run-to-run comparison Find the transaction and time window that changed between releases.

    Compare releases side by side using the complete result sets. See which transactions became slower, where the difference began, and which requests drove the regression.

    Historical runs remain useful evidence rather than disconnected report files, so “is it getting slower?” has a factual, request-level answer.

  • SLO validation Set objectives per transaction and validate every run automatically.

    Define service-level objectives for the transactions that matter and get an unambiguous pass or fail backed by the complete result set. Thresholds can live with the test and be applied consistently in manual runs and delivery pipelines.

    SLO validation turns a collection of graphs into a release decision without losing the detail required to explain a failure.

  • AI that actually takes action Analyzes results, explains anomalies, and improves scripts.

    The AI performance engineer reads the results, identifies likely bottlenecks, explains anomalies, and can update the script. It is designed to move from evidence to action instead of stopping at a chat response.

    Because the platform retains every measurement's metrics and the full evidence for errors, the analysis can point back to the measurements and time windows that support its conclusion.

  • PDF & HTML export Charts, percentiles, SLO results, and findings ready to share.

    Export comprehensive results as PDF or HTML, including charts, response-time percentiles, SLO validation, and AI-generated insights. Reports are designed to be useful to engineers and ready to share with stakeholders.

    The report summarizes the run while the platform keeps the measurement-level metrics and error evidence available for deeper questions.

Delivery & monitoring

  • Built for CI/CD pipelines One API call from GitHub Actions, GitLab CI, Jenkins, or any pipeline.

    Trigger a test with a single API call, follow its progress, and retrieve the final decision. BreakTest works with GitHub Actions, GitLab CI, Jenkins, and any other delivery system that can call an HTTP endpoint.

    Block deployments automatically when performance degrades or an SLO fails, with the complete run still available for investigation.

  • Synthetic monitoring Reuse performance scripts as scheduled production monitors.

    Turn the same tested user journeys into scheduled production monitors. This catches regressions between larger load tests and keeps one script moving from local validation to pipeline testing and continuous confidence.

    Monitoring results join the same history, analysis, and reporting workflow rather than becoming another isolated source of data.

  • API-first automation Start tests, follow status, fetch results, and enforce quality in code.

    The platform API covers the complete automated lifecycle: select a test, start a run, observe status, retrieve results, and use the SLO outcome as a gate.

    This keeps performance testing repeatable and makes it part of the delivery system instead of a manual event before a major release.

  • Projects, teams & useful history Organize scenarios, access, tokens, and months of comparable runs.

    Projects and teams keep scenarios, runs, access, and API tokens organized. Historical results stay connected to the test and release they belong to, making trends and comparisons part of normal engineering work.

    The result is a shared performance program rather than a folder of scripts and report files understood by one specialist.

Deployment & control

  • Managed or on-premises Choose the operating model that fits your organization.

    Use a managed platform for the fastest start, or deploy BreakTest Enterprise in your own cloud account or datacenter for maximum control.

    Your generators can run wherever the targets, credentials, and test data live in either model.

  • Your environment, your data Keep scripts, credentials, traffic, and results inside your network.

    With an on-premises deployment, the control plane, load generators, credentials, test data, and results remain inside your environment. There is no forced SaaS dependency for organizations with strict data or network requirements.

    The same live feedback, raw-data retention, automation, and analysis capabilities remain available behind your own boundaries.

Virtual users
100%Raw data stored
<1sTest start
3Test engines

Start free · upgrade when you need Enterprise scale

Run BreakTest Selfhost with a free license.

Create a three-month license with 250 virtual users, unlimited tests and test hours, and synthetic monitoring up to six checks per hour. No payment details and no checkout.

Get your free license →

Register and verify your email, then create your license in the customer portal.

Already have an account? Sign in

Ready to break things?

Find out what your application can really handle.

Create your account, verify your email, and generate your own free Selfhost license. No payment details or approval required.